We are happy to deliver the brandnew September 2021 release with the new dynamic list reports!Try it now!
Remember, the Web Client is the user friendly spreadsheet for your Collector Users to deliver their monthly/weekly/daily data. The Web App is the tool for the Power User to setup and control your organization’s collection workflows.
(1) Web App: New workflow timeline overview
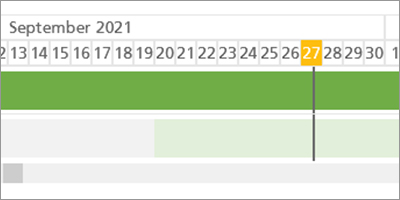
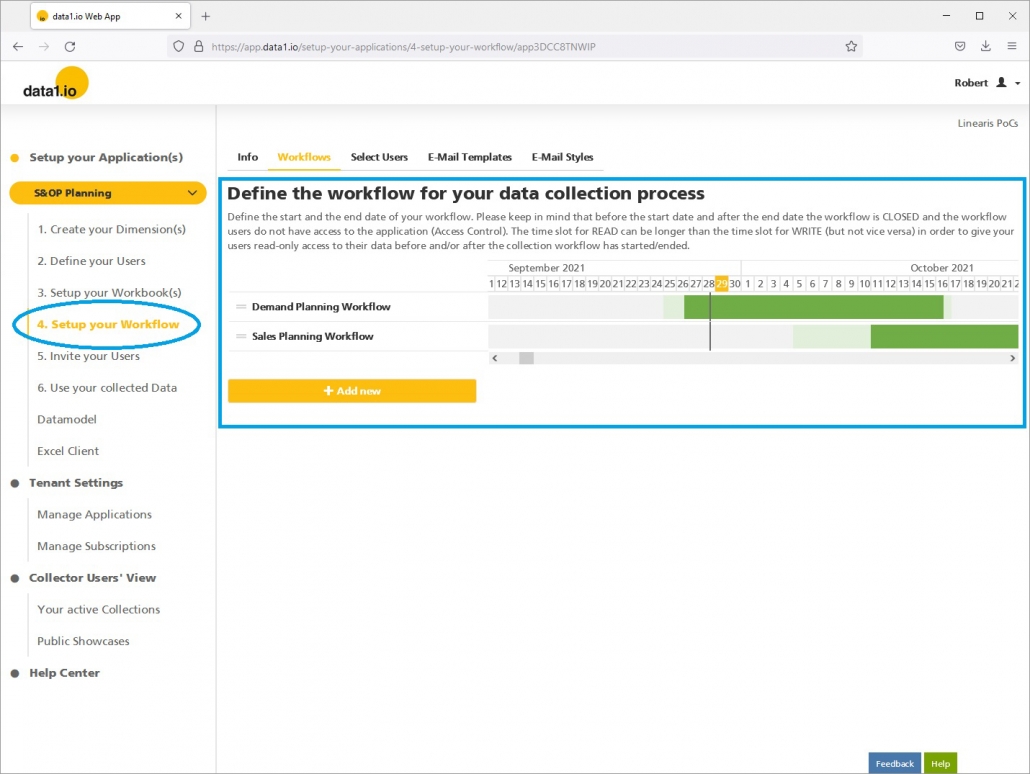
We are really proud to present the new workflow timeline overview. You’ll see all your defined workflows in a graphical timeline visualization with a vertical bar for “Today”. This way it is very easy to see which workflows run at the same time and how long they will run.
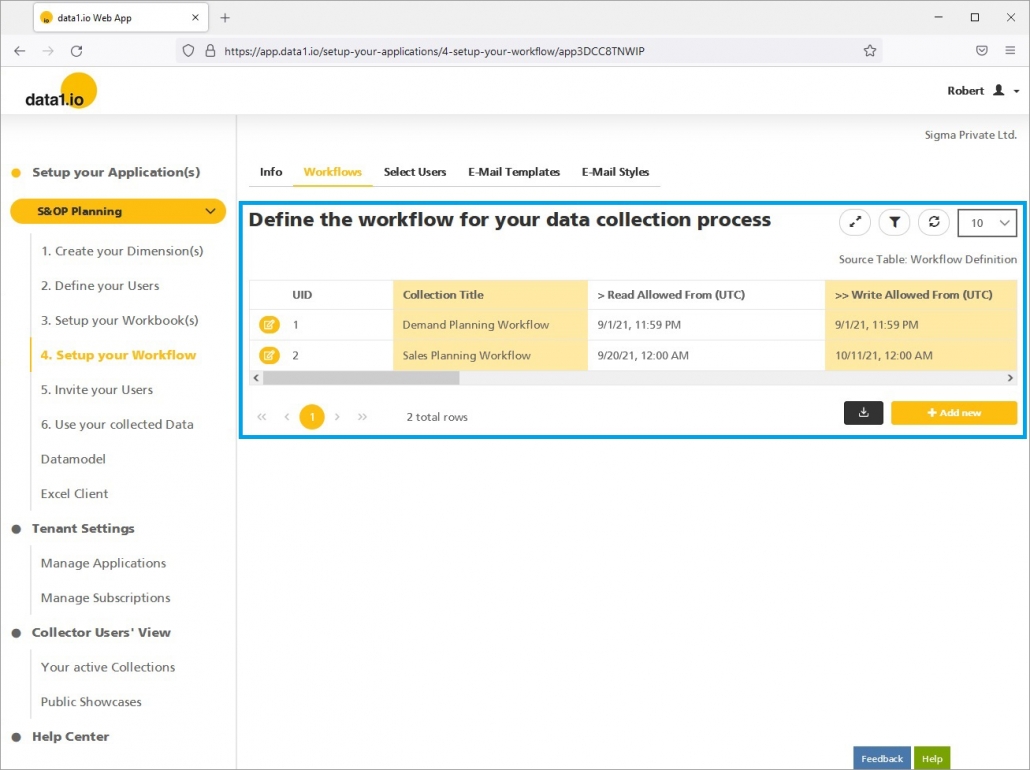
For comparison, until now we only had this (very unintuitive) table based view on the workflows:
(2) Web App: New workflow editor
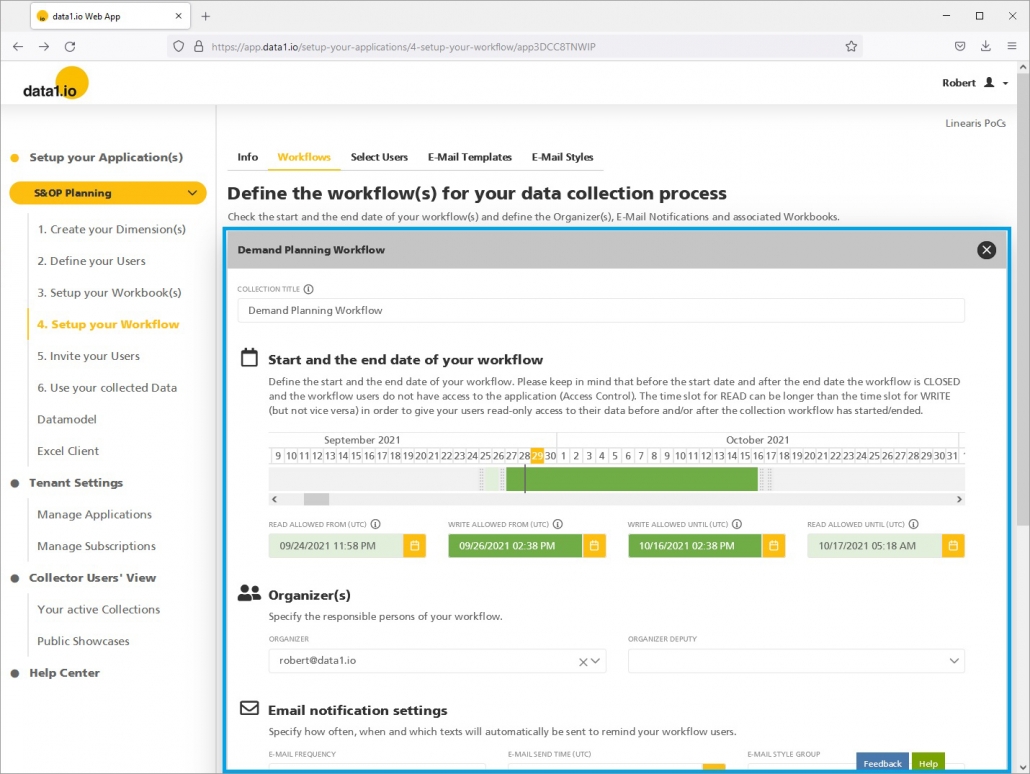
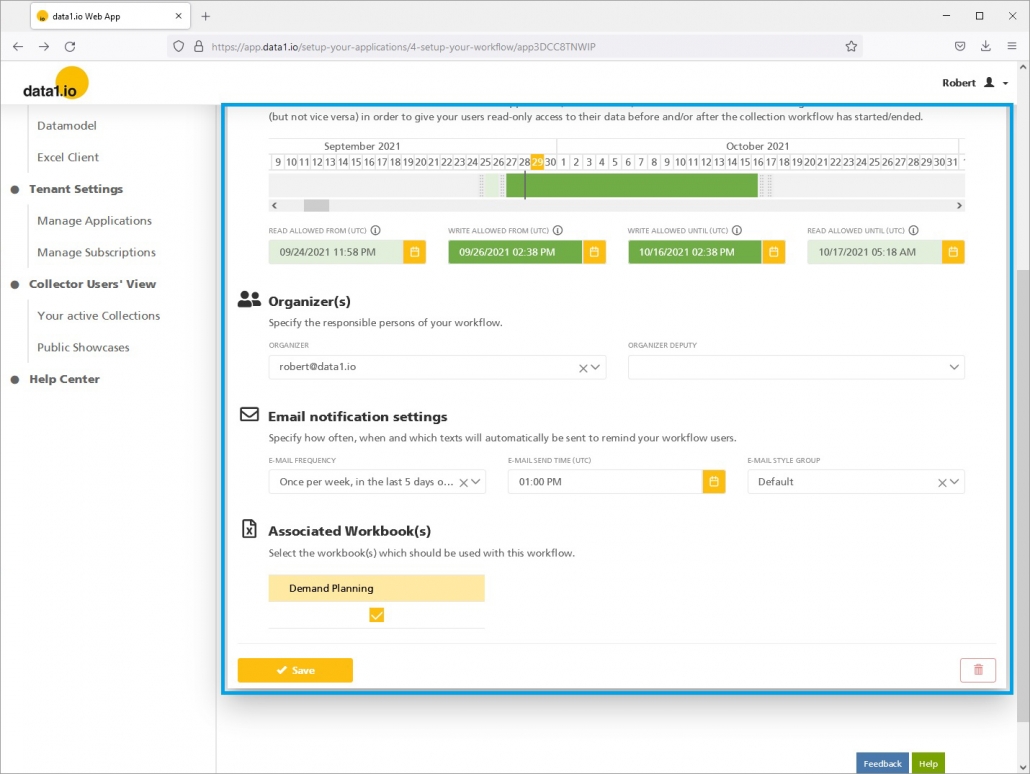
Embedded in the new timeline overview you’ll find the new editor for your workflows. You can change here start end date both visually by pulling the slider or by selecting the date from the data picker:
The form is structured into topics which makes the definition of a workflow much more intuitive than before:
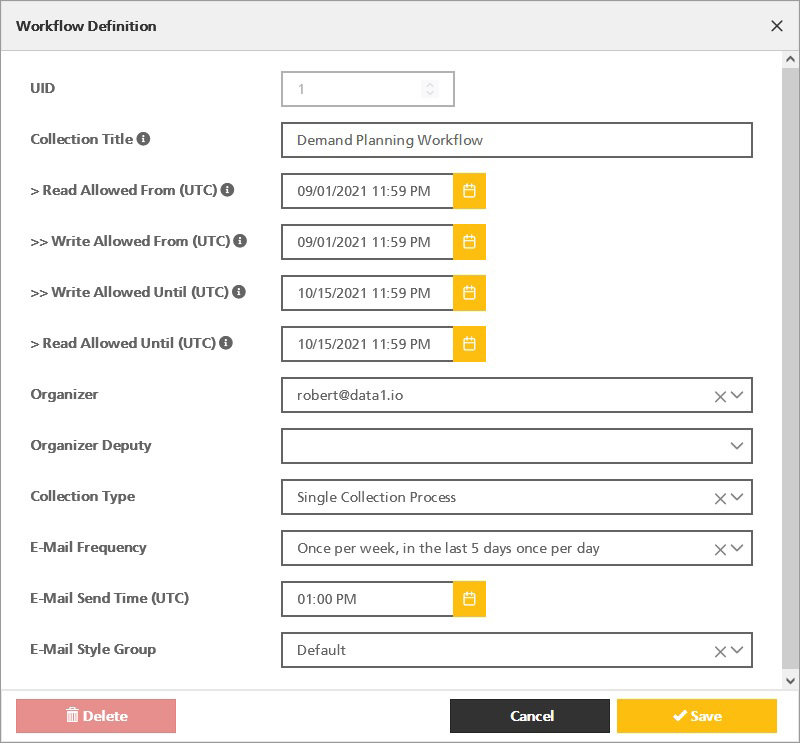
For comparison, this was our data entry form for workflows until now:
(3) Web App: New UI form
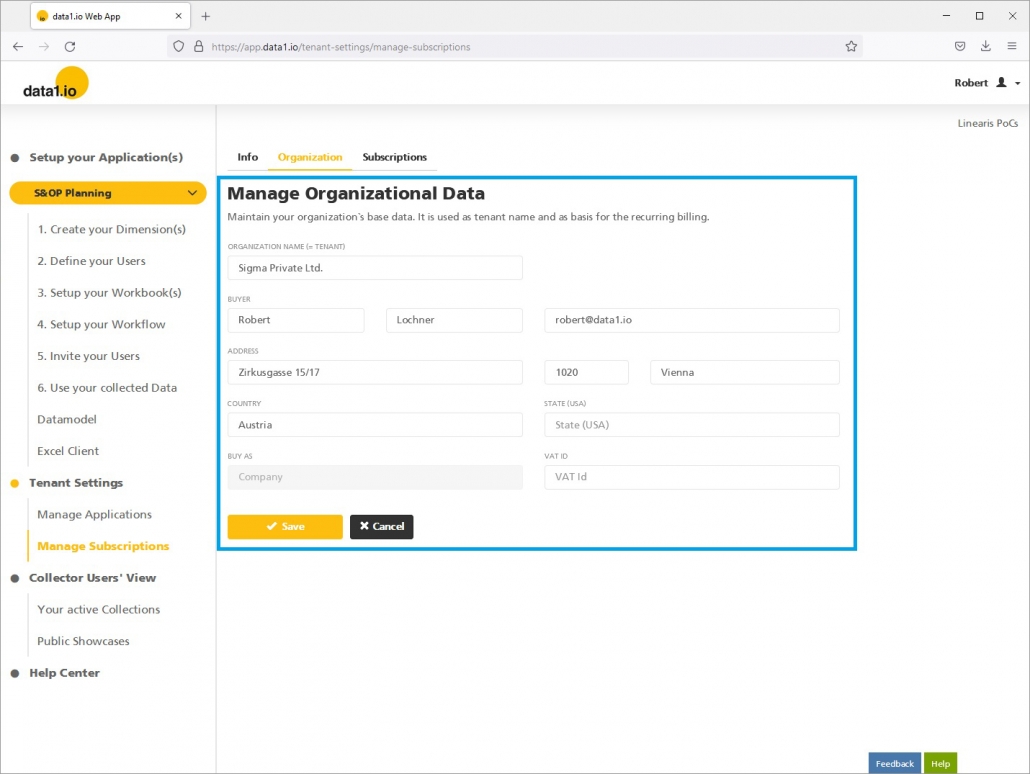
We have developed a new “standard form” for entering the organizational data in your tenant. This form looks “quite normal” as you probably are used to from other cloud services.
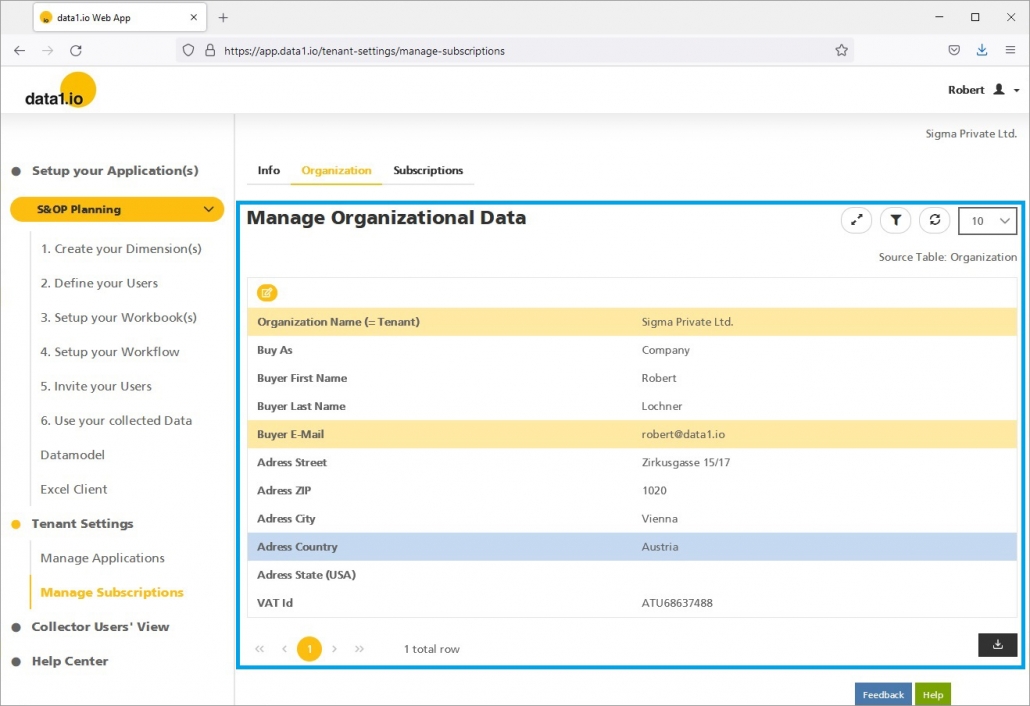
For comparison, our “table based form” was not really suitable for this kind of data:
This was a simple solution for the start of your system but now we replace it with the new intuitive form. We plan to roll out this new form to more topics within the next months.
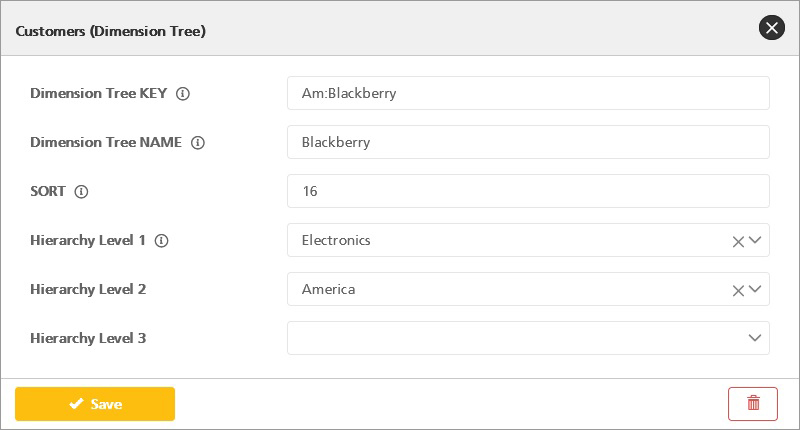
(4) Web App: New UI elements
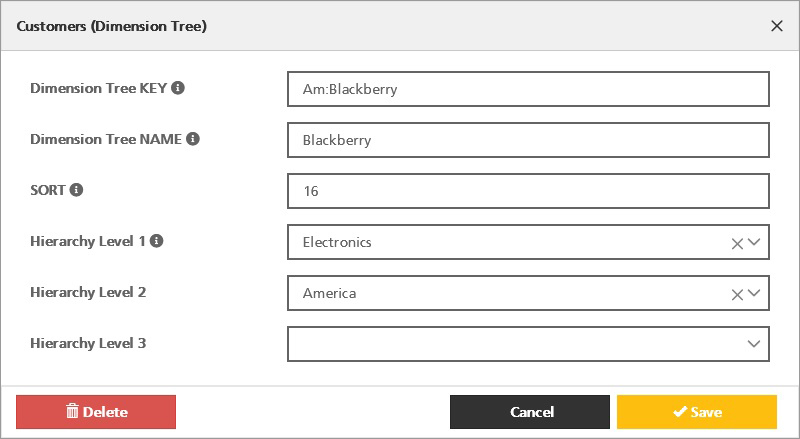
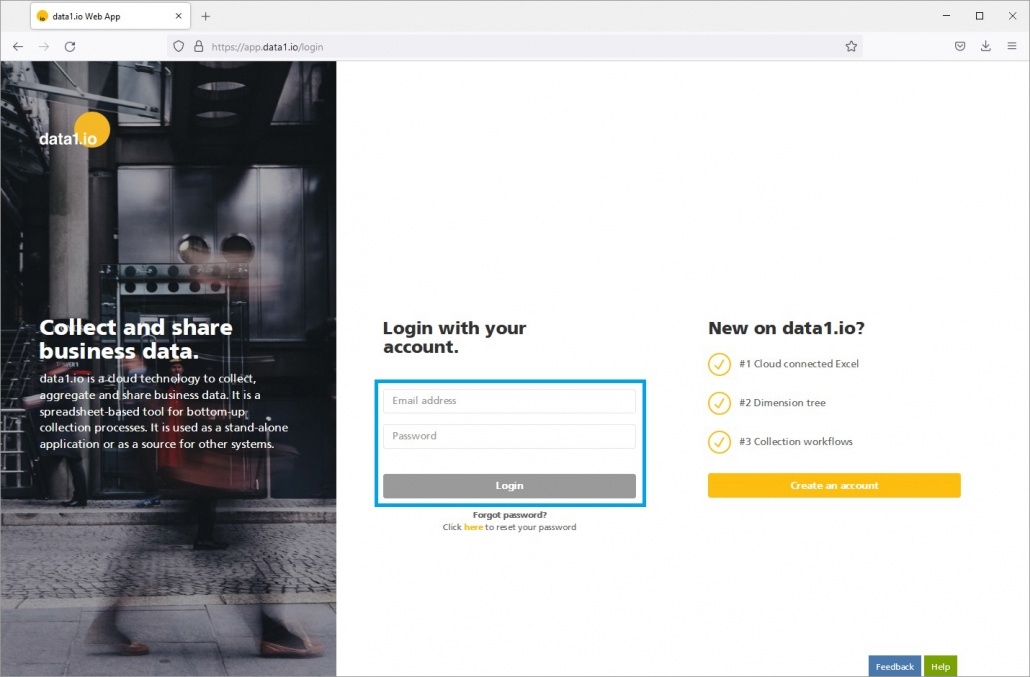
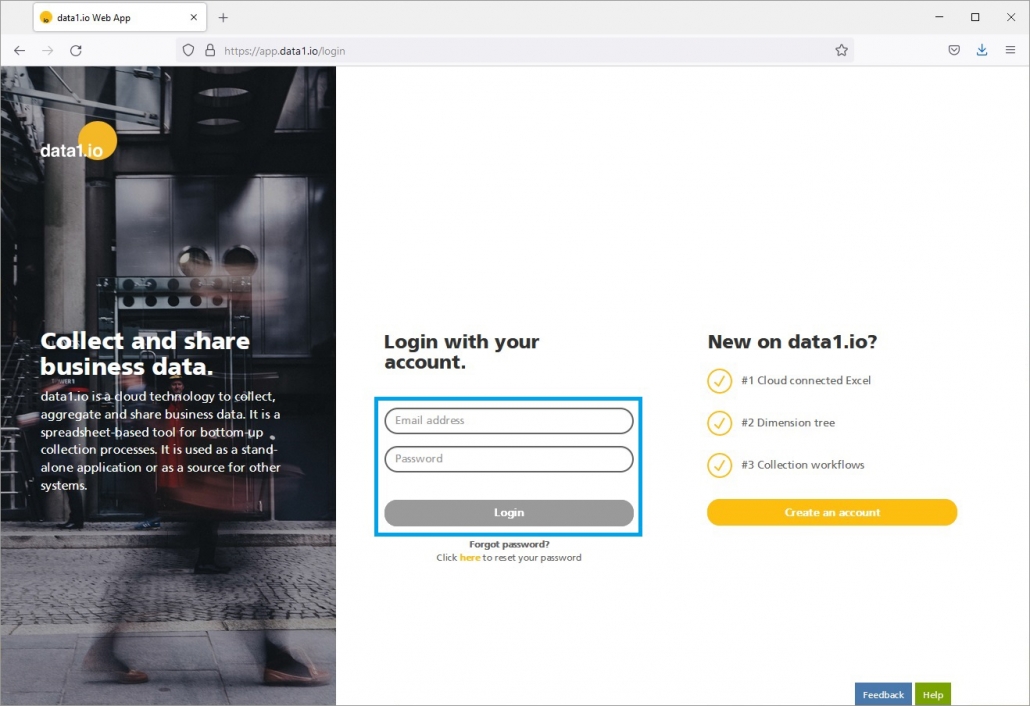
With the new workflow editor and the new UI form we have streamlined and modernized the look & feel of the whole data1.io Web App.
Compare the new record editor …
… with the old one:
And compare the new login form …
… with the old one.
We will continue this process of modernizing the UI within the next months in order to bring the user experience of our Web App to the next level.
(5) Web Client: Performance improvement for the READ process
In workbooks with many cells activated for the data1.io READ process (named range “”data1_CELLS01) we had a performance issue since the check which cells in this area exactly have to be cleared (as part of the READ process) took a long time in this case. We have solved this issue and the READ process gained a huge performance win in this applications.
Hope you like the new features – we are very curious about your feedback! Please let us know what you think and what kind of collection processes you would prefer to automate with data1.io.
And: stay healthy!
https://data-one.cloud/wp-content/uploads/2021/09/September-2021-Release-Title.jpg200400Robert Lochnerhttps://data1.io/wp-content/uploads/2021/06/data1.io_Logo_Black-Orange-184-x-300-300x184.pngRobert Lochner2021-09-29 15:58:492021-09-29 15:58:51Release September 2021
We are happy to deliver the brandnew July 2021 release with the new dynamic list reports!Try it now!
Remember, the Web Client is the user friendly spreadsheet for your Collector Users to deliver their monthly/weekly/daily data. The Web App is the tool for the Power User to setup and control your organization’s collection workflows.
(1) Web Client: New dynamic list reports
Until now, it was only possible to show aggregated values on the aggregated levels of the dimension tree:
With this release you can create reports like this which show the elements from the dimension tree in the report itself:
Of course, those reports can be filtered dynamically by double clicking in the dimension tree:
This new type of report uses the following new features:
New filter tables
New “data1_CELLS01_DIM001_Attribute” parameter
New list form for the “data1_CELLS01_DIM001” parameter
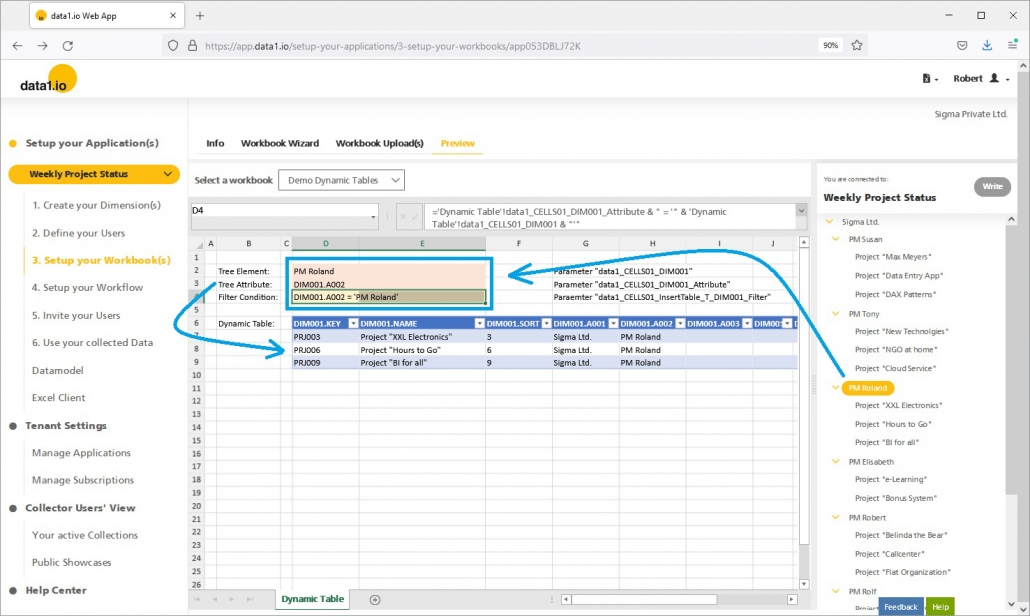
(2) Web Client: New filter tables
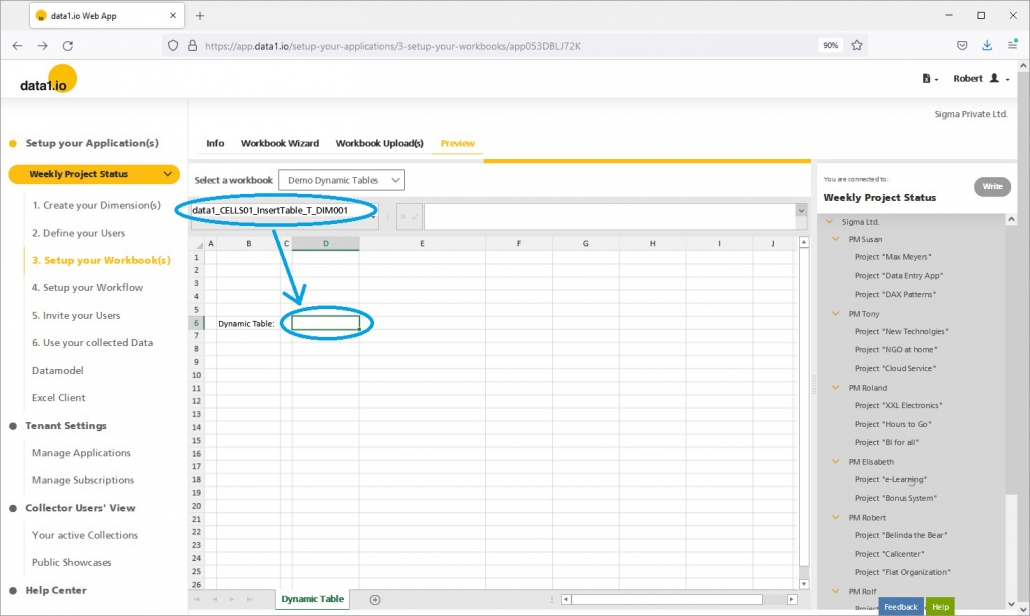
With this release you can query all dimension tables from your datamodel simply by using the following named range:
data1_CELLS01_InsertTable_T_DIMxxx
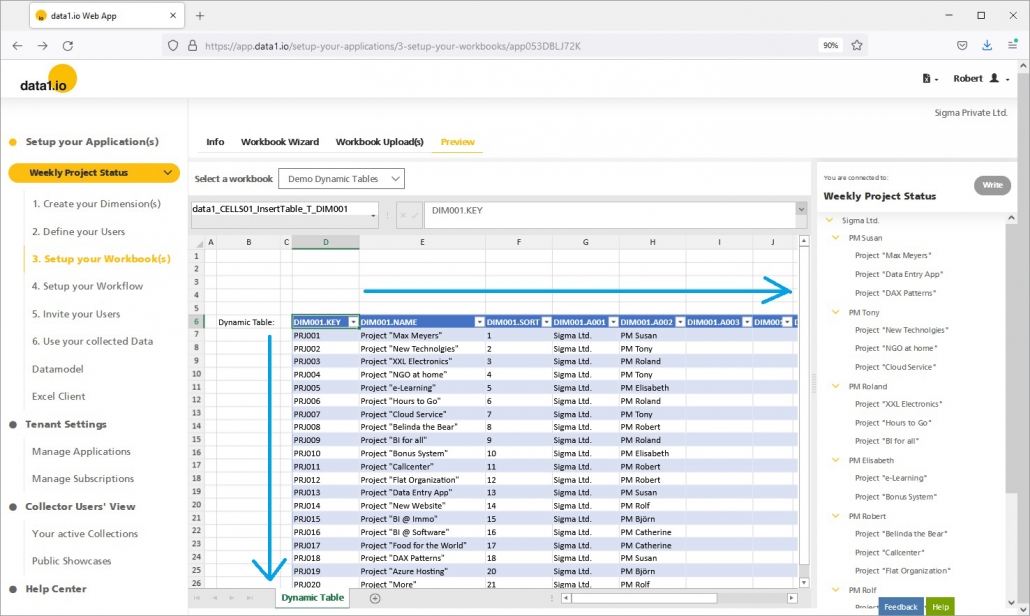
After the READ process has been executed …
… an Excel table with the dimension data is inserted starting at the defined cell:
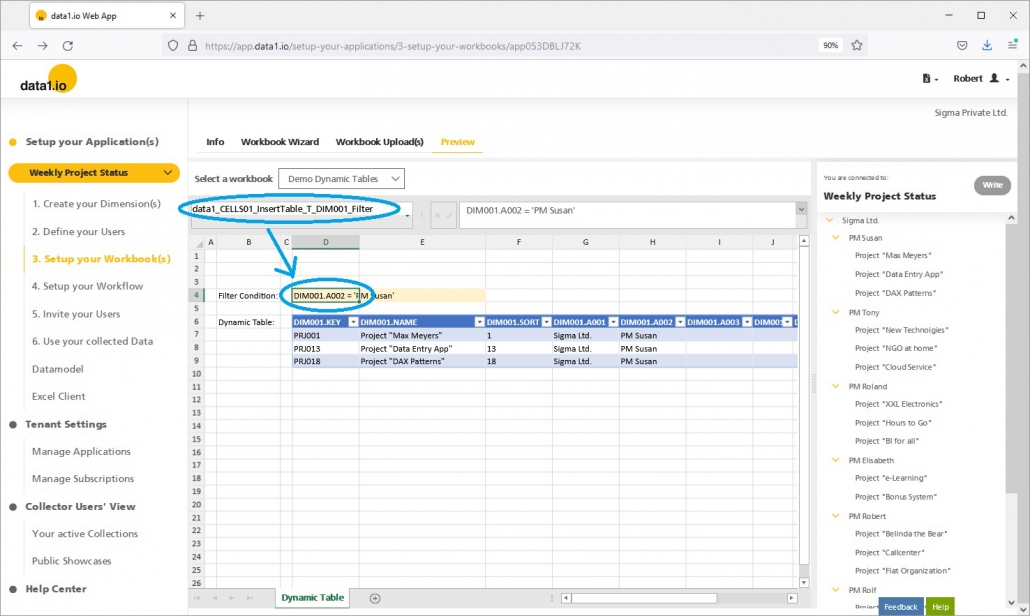
Furthermore, you can add an filter condition which has to be written in the syntax of an “SQL where clause” using the following named range:
data1_CELLS01_InsertTable_T_DIMxxx_Filter
Please note that there a several restrictions at the moment:
Row Level Security (RLS) is NOT applied as filter
The filter table is read only (it is NOT possible to write changes back to the datamodel)
(3) Web Client: New “data1_CELLS01_DIM001_Attribute” parameter
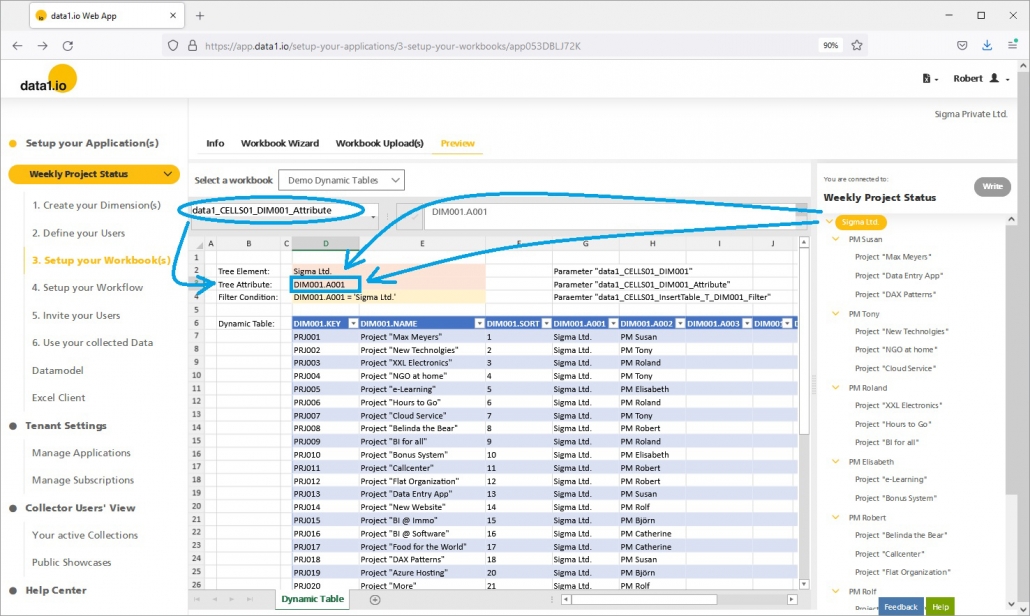
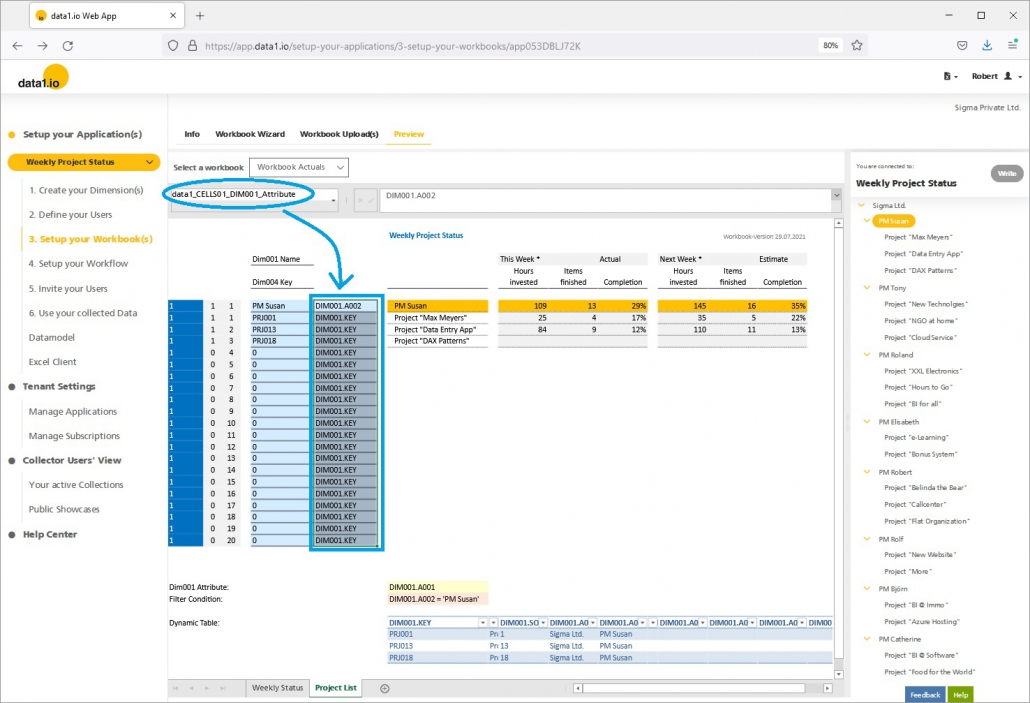
There is only 1 thing missing to link the table to the selected element from the dimension tree: the name of the field from the selected element in the dimension tree. You can query this information now with this new named range:
data1_CELLS01_DIM001_Attribute
You can combine now the selected element with the attribute behind it in order to define a dynamic filter statement for the table:
Selecting another element from the dimension tree triggers a new query of the dynamic table and you get a new filtered table:
(4) Web Client: New list form for the “data1_CELLS01_DIM001” parameter
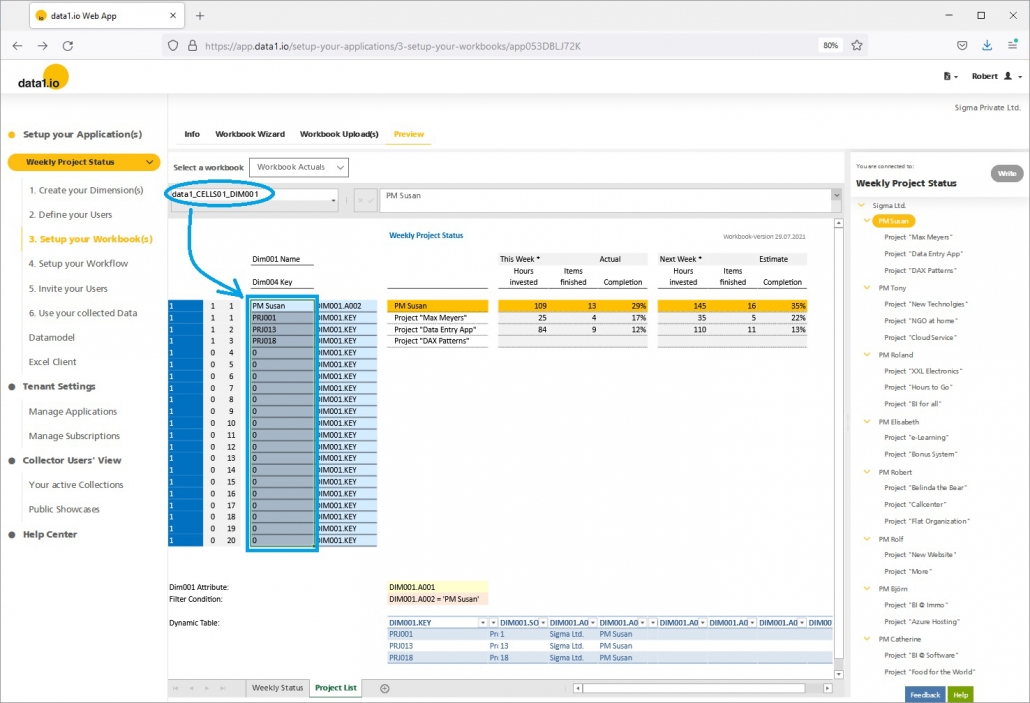
Until now, the parameter “data1_CELLS01_DIM001” had to be a single cell. With this release, you can define this parameter as a horicontal or vertical range. Double clicking an element in the dimension tree will transfer the name of the selected element to the first cell of the named range and the other cells from the named range will also be used as filter parameter for the query of the values in the cells area:
The same is true for the new parameter ” data1_CELLS01_DIM001_Attribute”:
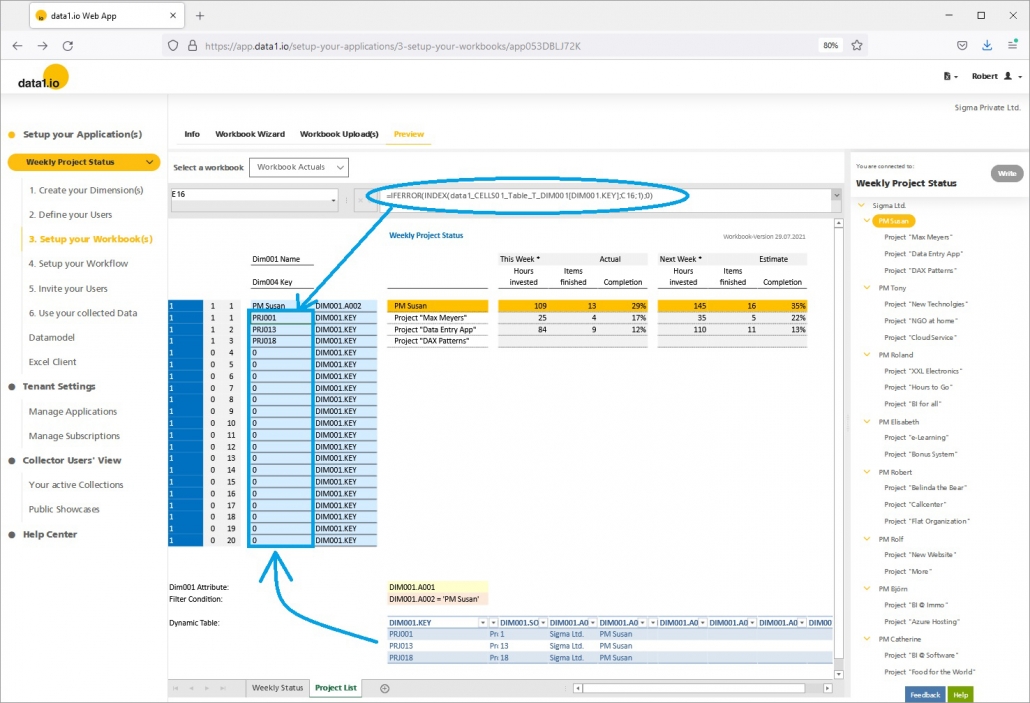
Finally, you can connect the cells area with the READ/WRITE interaction with the dynamic filter table e.g. by using the INDEX() formula in order to get the elements from the filter table in relative order into the cells area:
Please note that there a several restrictions:
At the moment only the Measure fields and NOT the Text fields are retrievable
At the moment those sheets are read only (so it is NOT possible to write back data entries)
(5) Web Client: New vertical ByColumnMapping definition
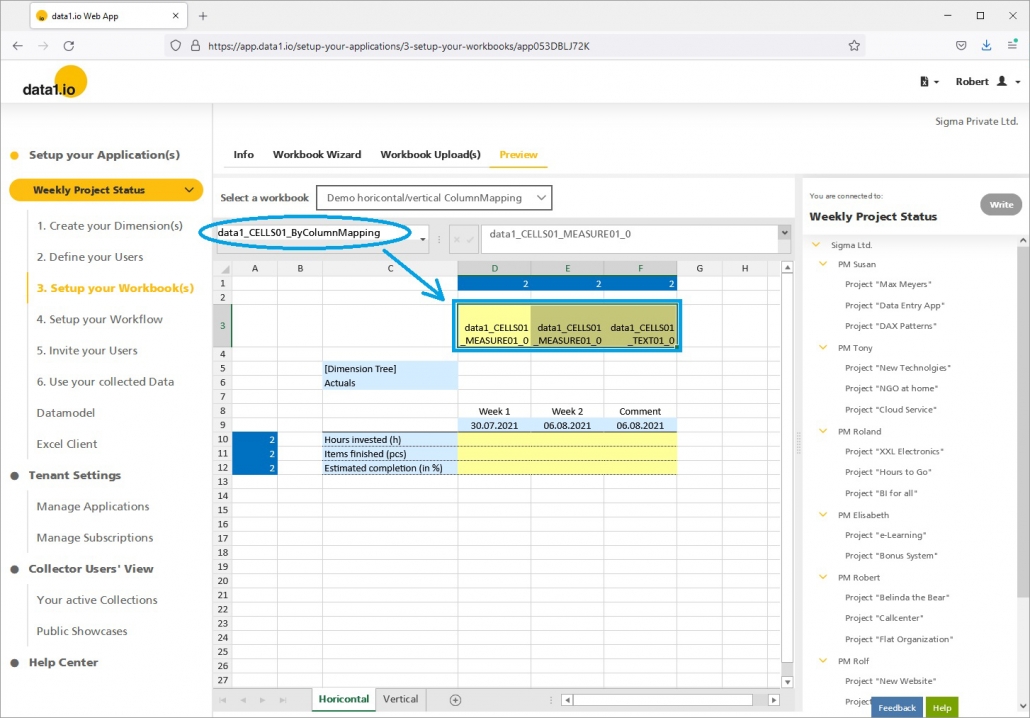
The next feature has nothing to with the new dynamic list reports. Until now, the named range “data1_CELLS01_ByColumnMapping” could only be used in a horicontal list form …
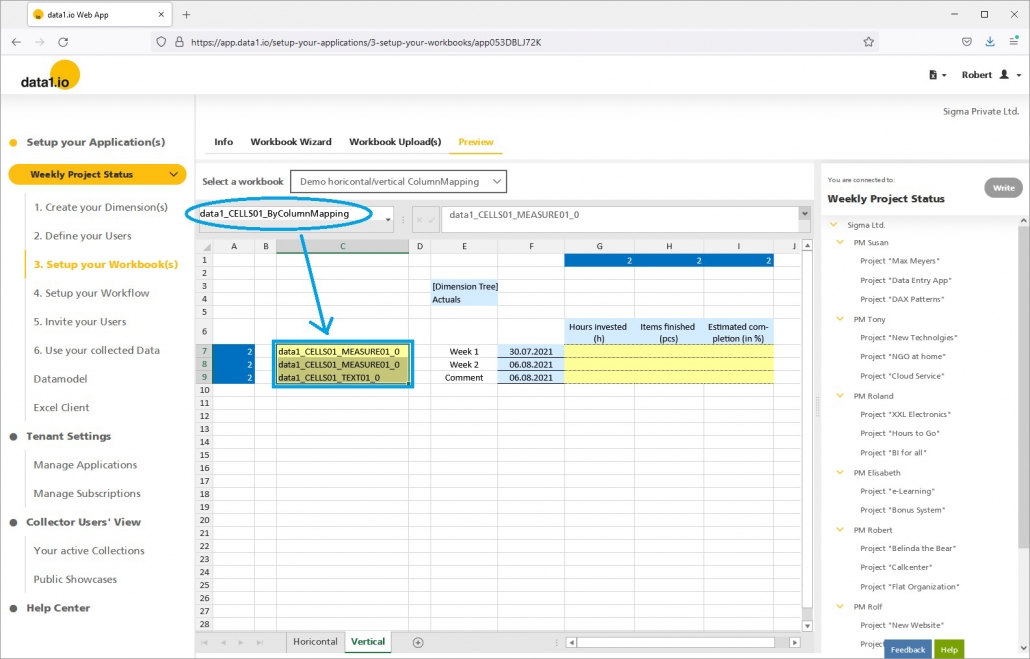
… with this release you can use this definition also in vertical list form which makes many more usecases realizable:
(6) Web Client: New Exception Type 0
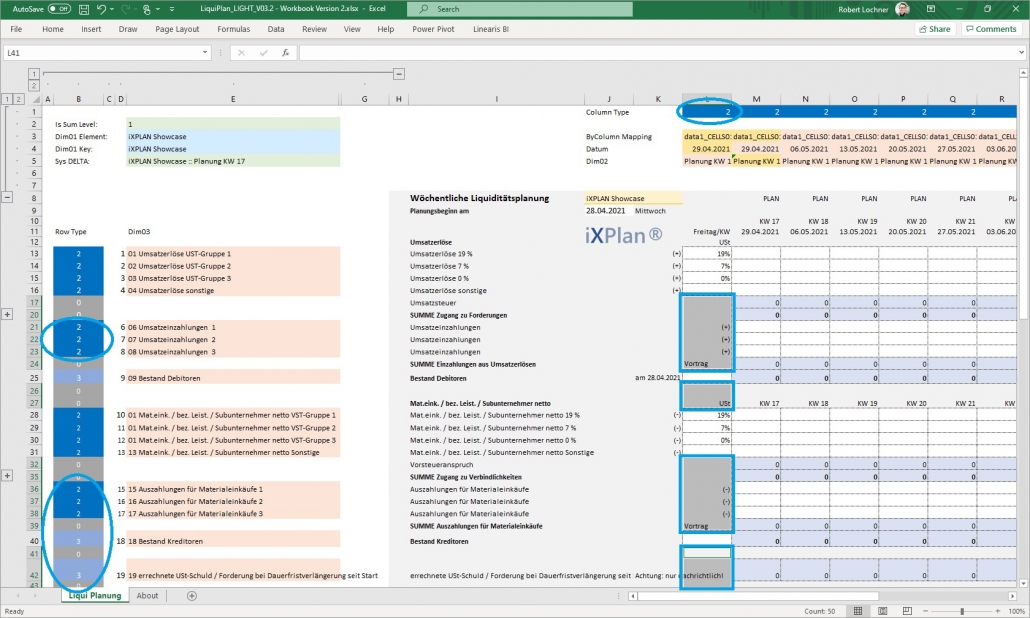
Exception types overrule the definition from R/W control panel. This is useful if you have rows or columns which are partly relevant for the Read/Write process and partly not:
data1_CELLS01_ExceptionType0
Please note that the other exception types (1 to 4) were already available.
Hope you like the new features – we are very curious about your feedback! Please let us know what you think and what kind of collection processes you would prefer to automate with data1.io.
We`ll be back after the summer break with the September Release!
And: stay healthy!
https://data-one.cloud/wp-content/uploads/2021/07/July-2021-Release-Title.jpg200400Robert Lochnerhttps://data1.io/wp-content/uploads/2021/06/data1.io_Logo_Black-Orange-184-x-300-300x184.pngRobert Lochner2021-07-29 23:37:562021-07-29 23:47:04Release July 2021 (before the summer break)
We are happy to deliver the brandnew June 2021 release with the new Multi-Workflow feature and new Trigger Cells. With this release we leave now the public beta stage – data1.io is now generally available! Yeah, let`s celebrate! Try it now!
Remember, the Web Client is the user friendly spreadsheet for your Collector Users to deliver their monthly/weekly/daily data. The Web App is the tool for the Power User to setup and control your organization’s collection workflows.
(1) New Multi-Workflow Mode: Collector Users’ view
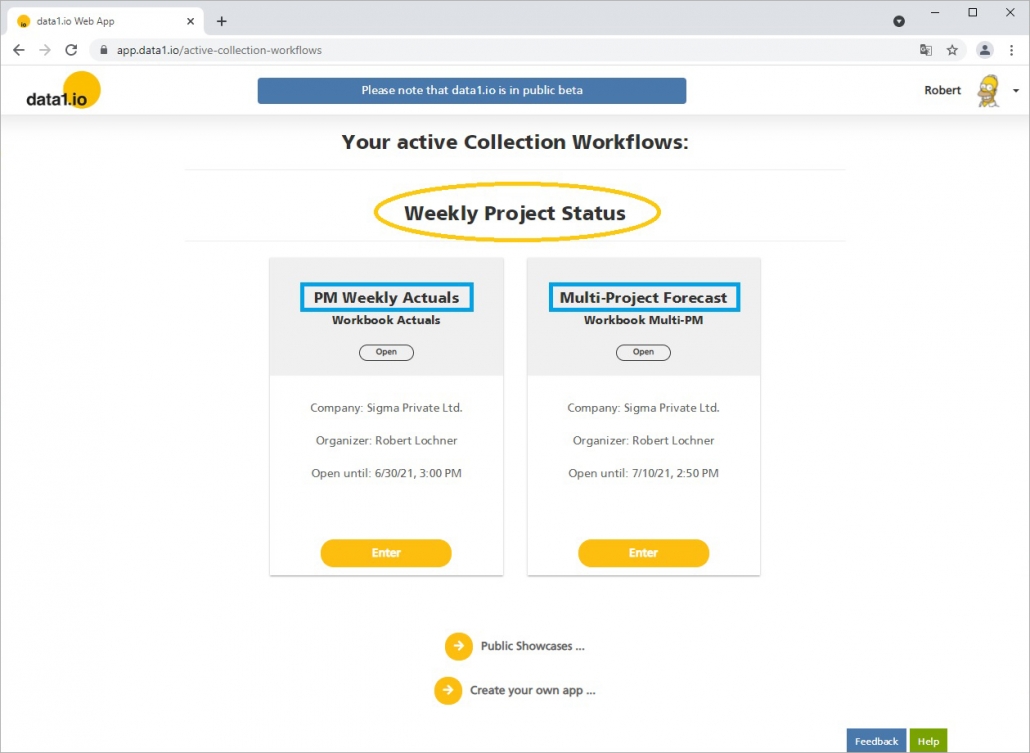
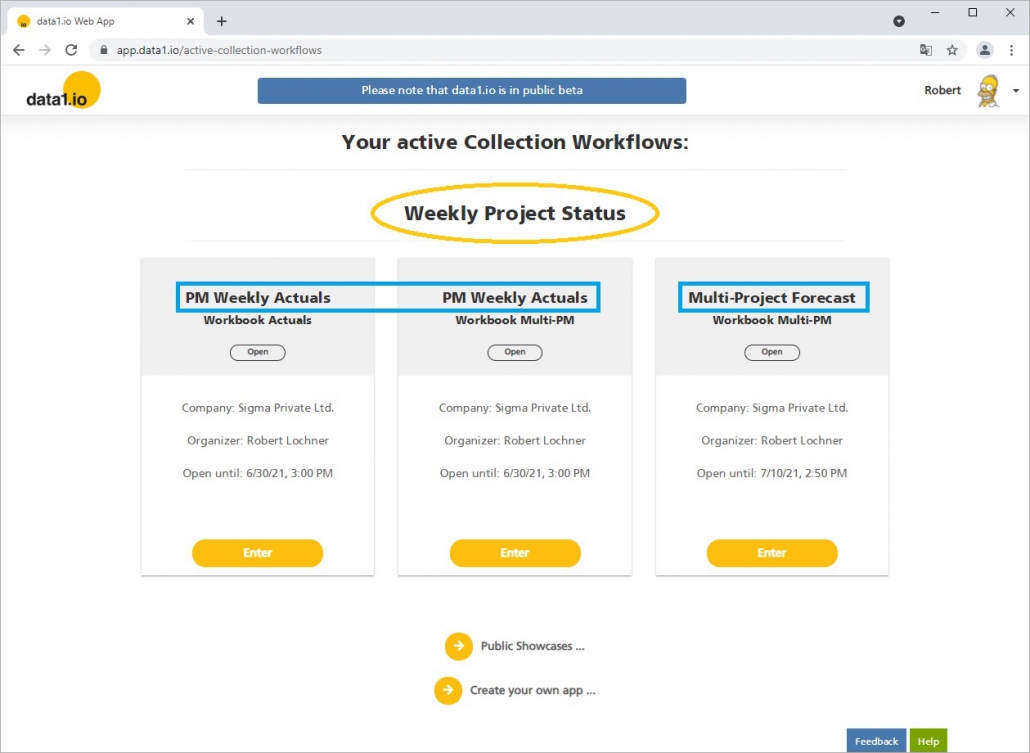
With the April 2021 Release we got the possibility to have more than 1 workbook in an application. From now on it is also possible to run several workflows at the same time within the same application. Every workflow can have its own workbook …
… or several workbooks can share the same workbook(s):
(2) New Multi-Workflow Mode: Power Users’ view
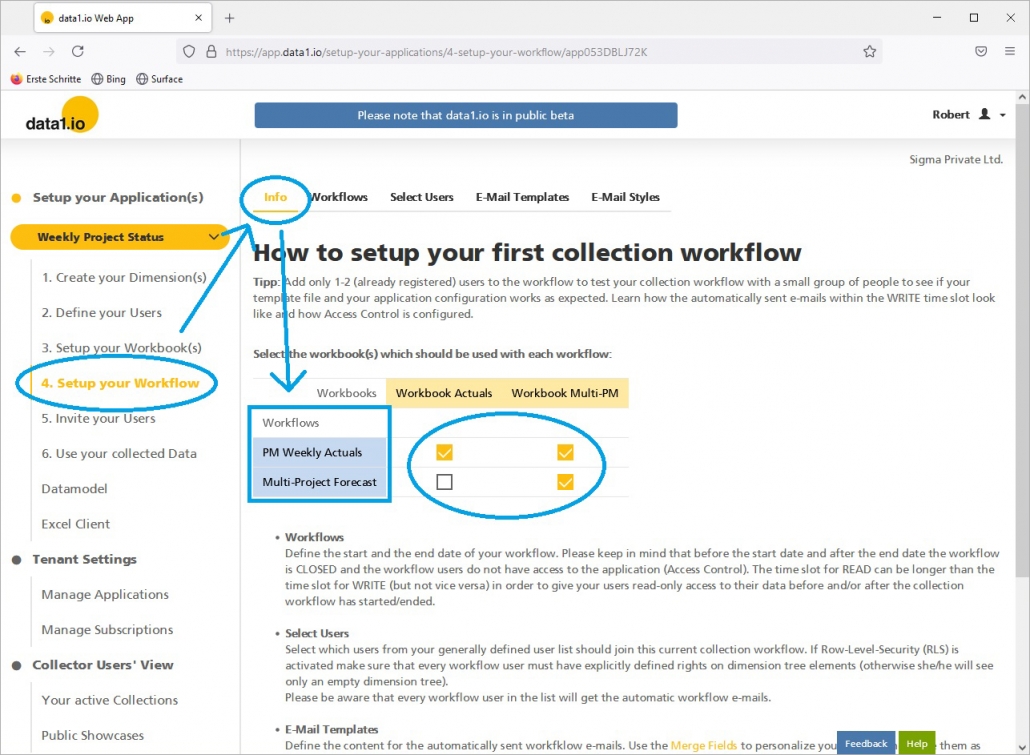
The most important new thing for the power user is the new assignment table where you define which workbook is valid for which workflow:
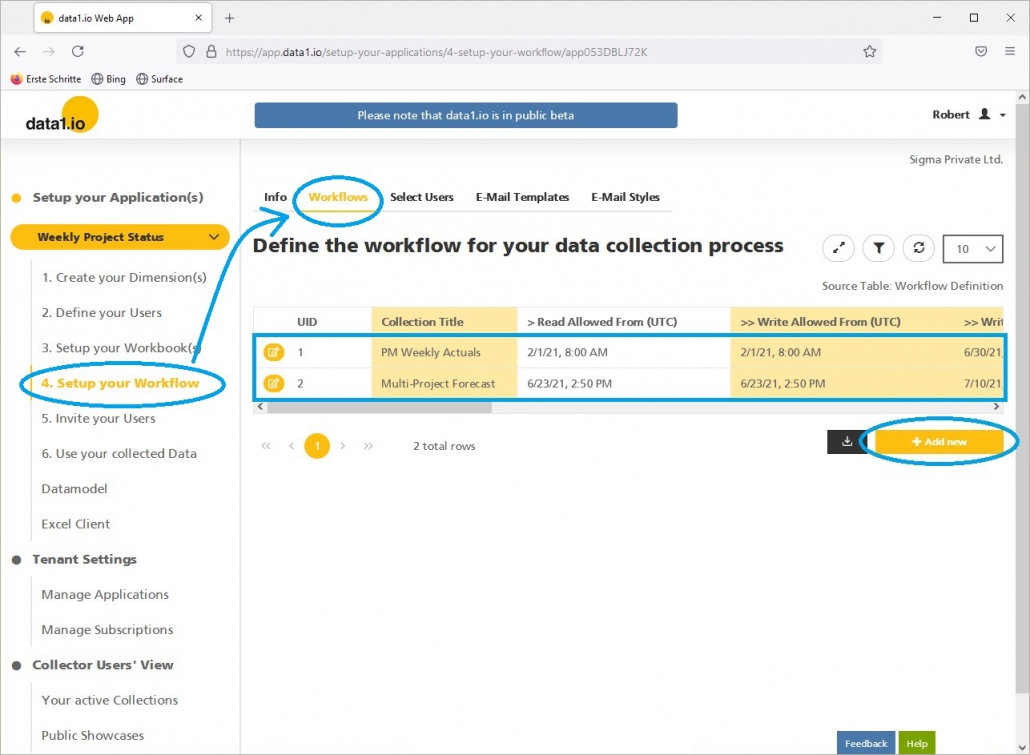
In the Workflows section we added the Add new button where you can define now as many workflows as you need. They can run at the same time or in different time slots:
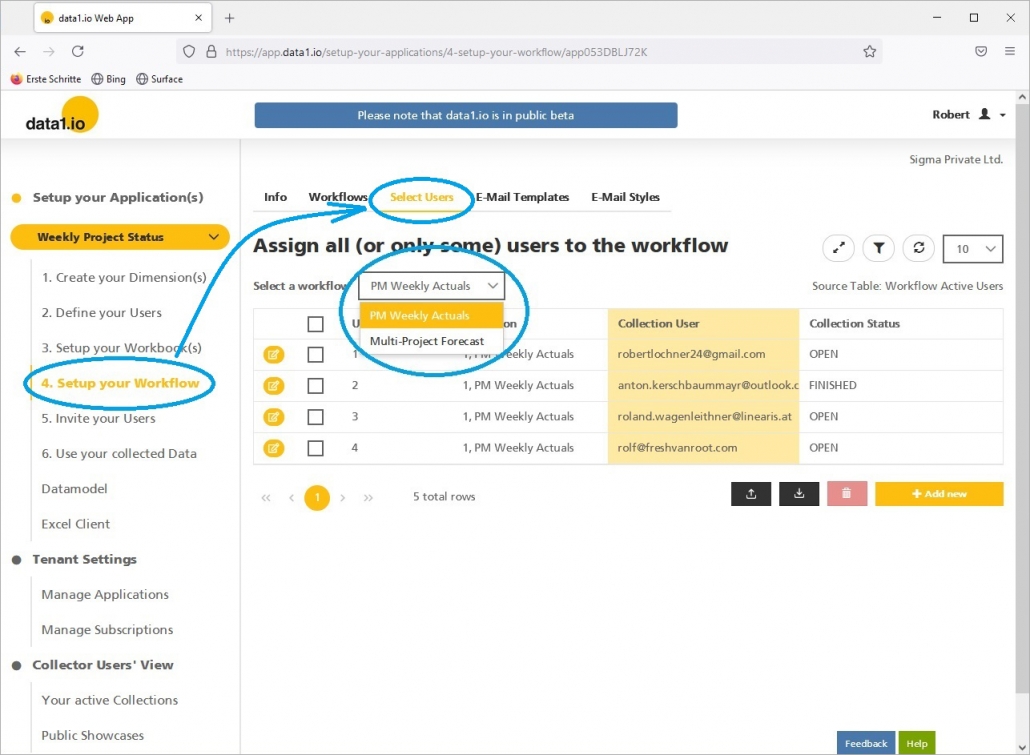
All existing definition tables for workflows have got now a dropdown selection where you can select the workflow you want to define:
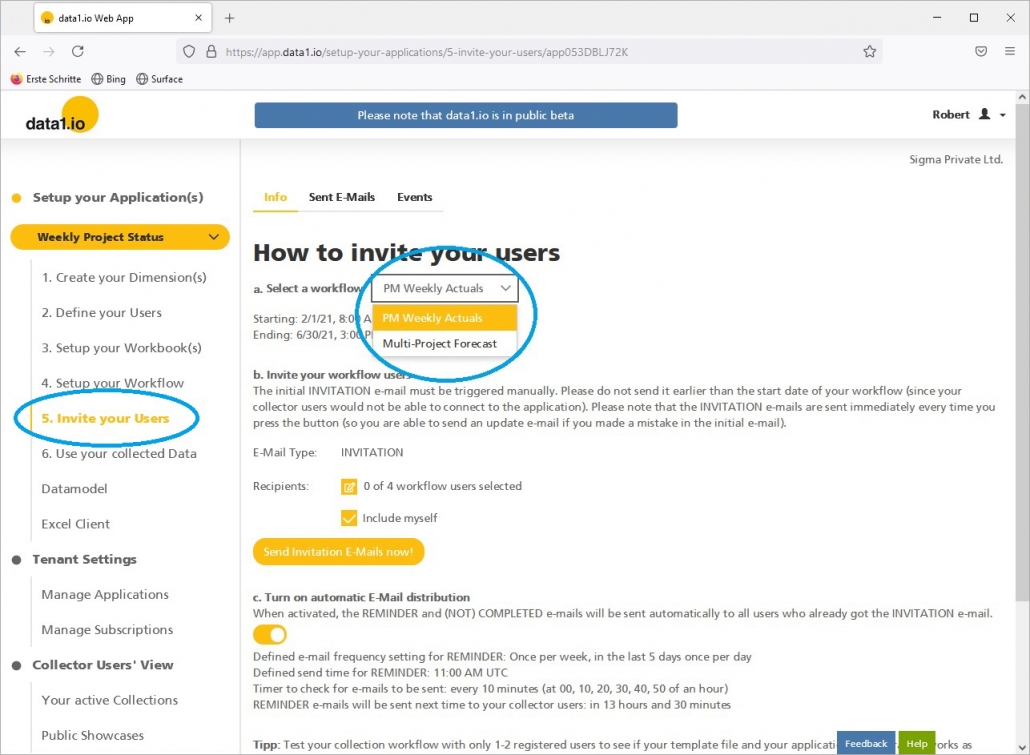
The Invitation section has got a workflow dropdown as well which means that the invitation mails are sent now for every workflow seperately:
Please note that at this stage the Workflow e-Mails cannot be defined seperately (i.e. all workflows use the same e-Mail Templates). Furthermore we want to announce that we will adopt our pricing which is based now on users/applications and we will transform that to users/current workflows.
(3) Web Client: New trigger cells
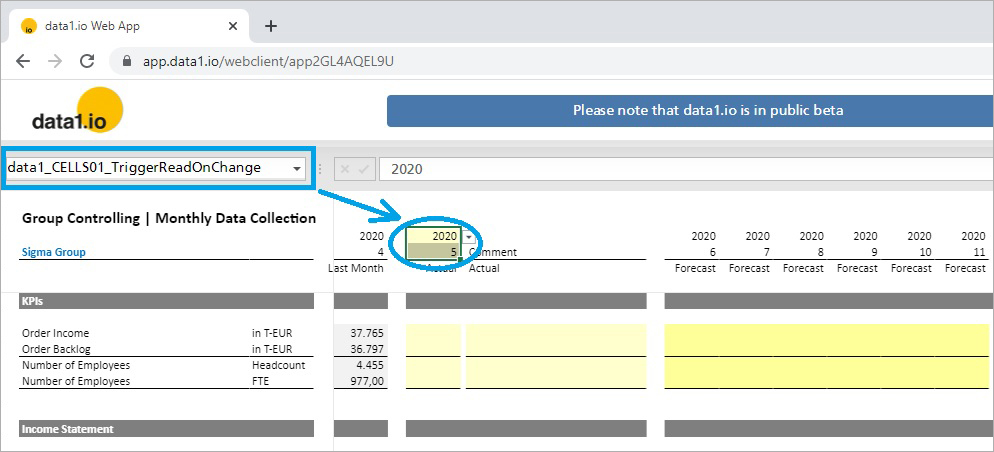
We are happy that we can deliver now the new trigger cells. As soon as a cell within the named range data1_CELLS01_TriggerReadOnChange is changed, a read process (= refresh will be triggered).
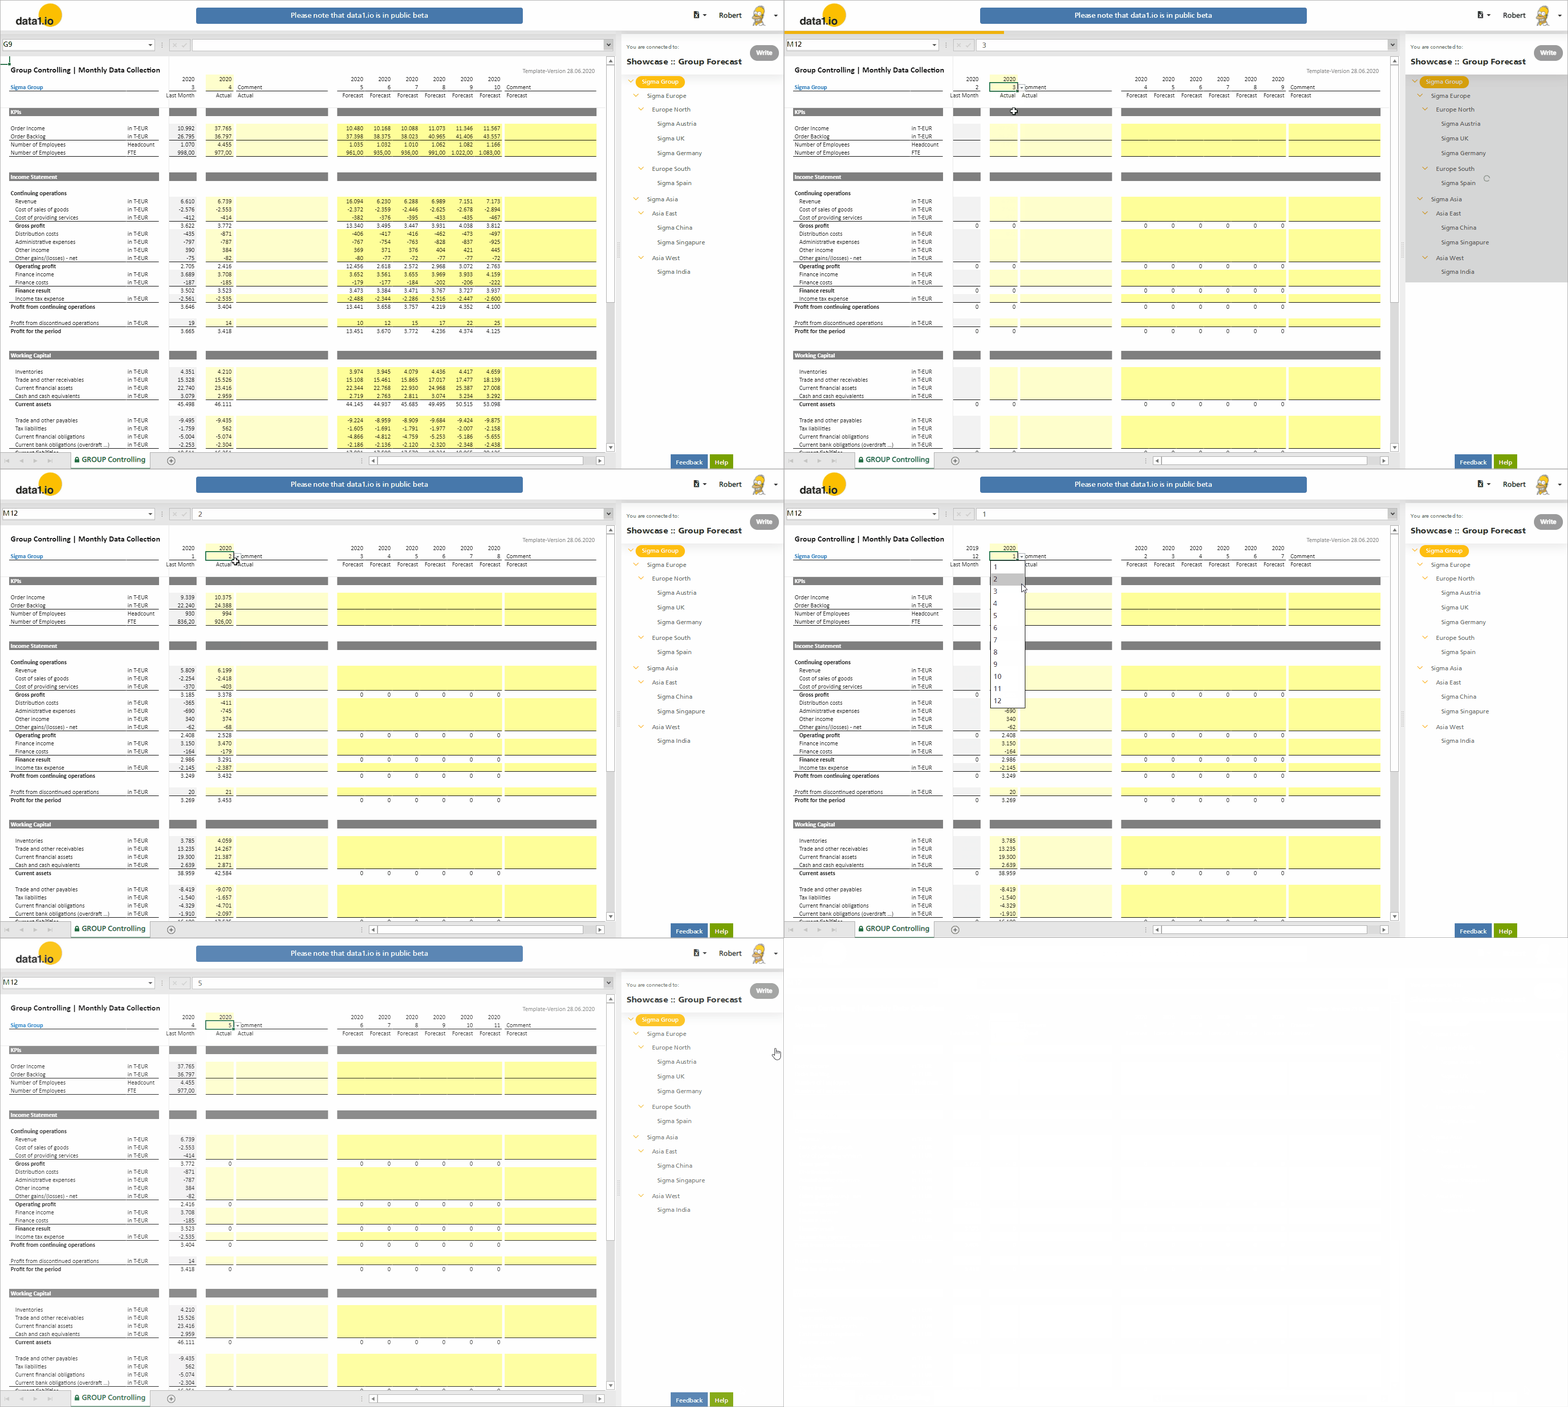
With this new feature you can intensively use dropdowns in your workbooks in order to refresh the queries:
Please note that there is another named range data1_CELLS01_TriggerTreeSelectionAndReadOnChange which makes it possible to select a dimension tree key within a dropdown, pass it to the dimension tree and then trigger the read process (= refresh).
(4) Web Client: Read first bottom element
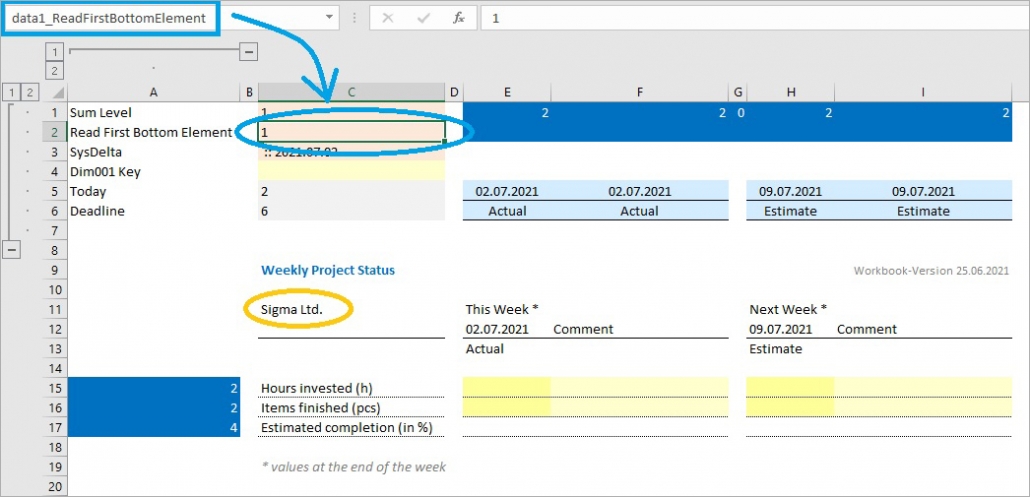
Another useful definition ist the new “data1_ReadFirstBottomElement = 1” setting …
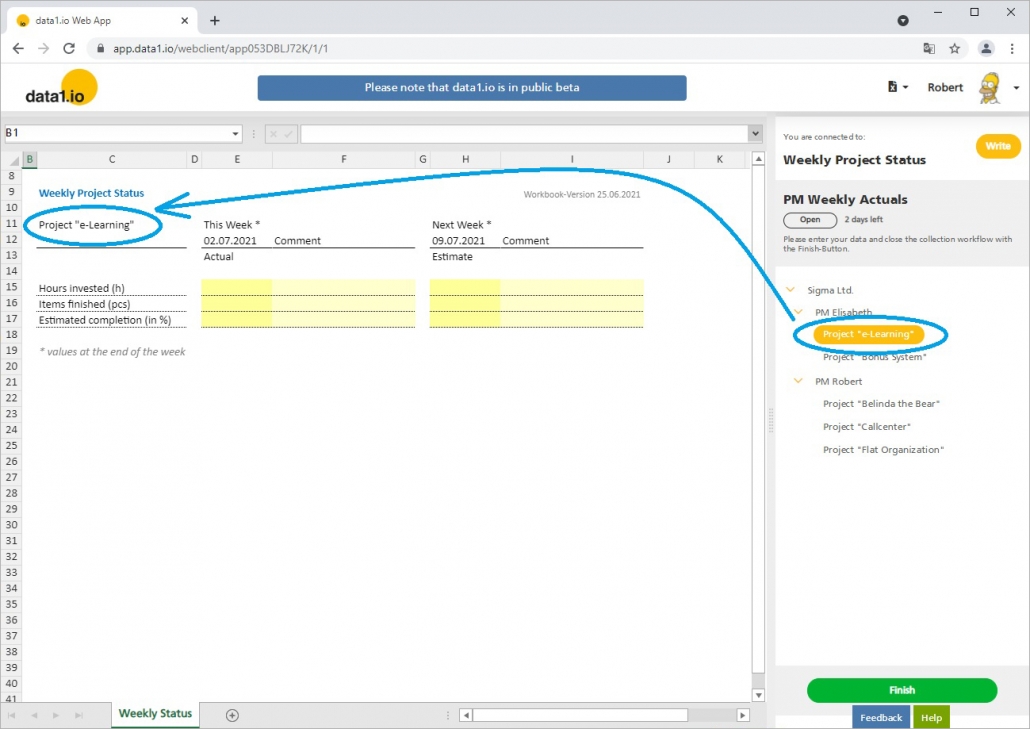
… since this will force the automatic selection of the first element in the dimension tree when opening the workbook:
Please note that this feature is “Row Level Security sensitive”, i.e. the first element the current user has rights for will be selected.
(5) Web App: Upload from Excel Files with Formulas
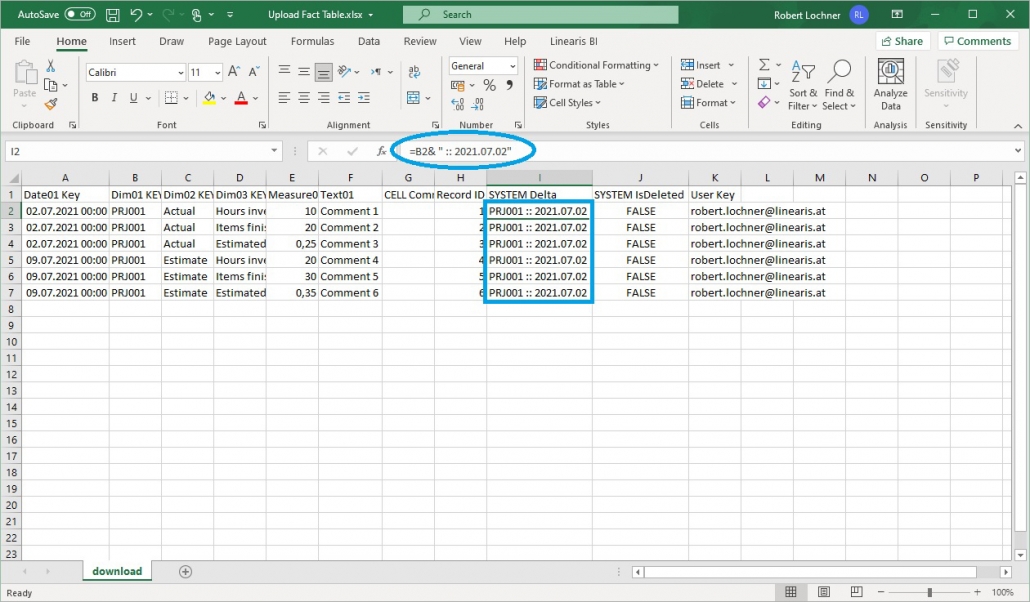
Until now you got an error when you tried to upload an Excel file into a data1.io table which contained formulas. From now on this issue is solved and you can upload also files with formulas:
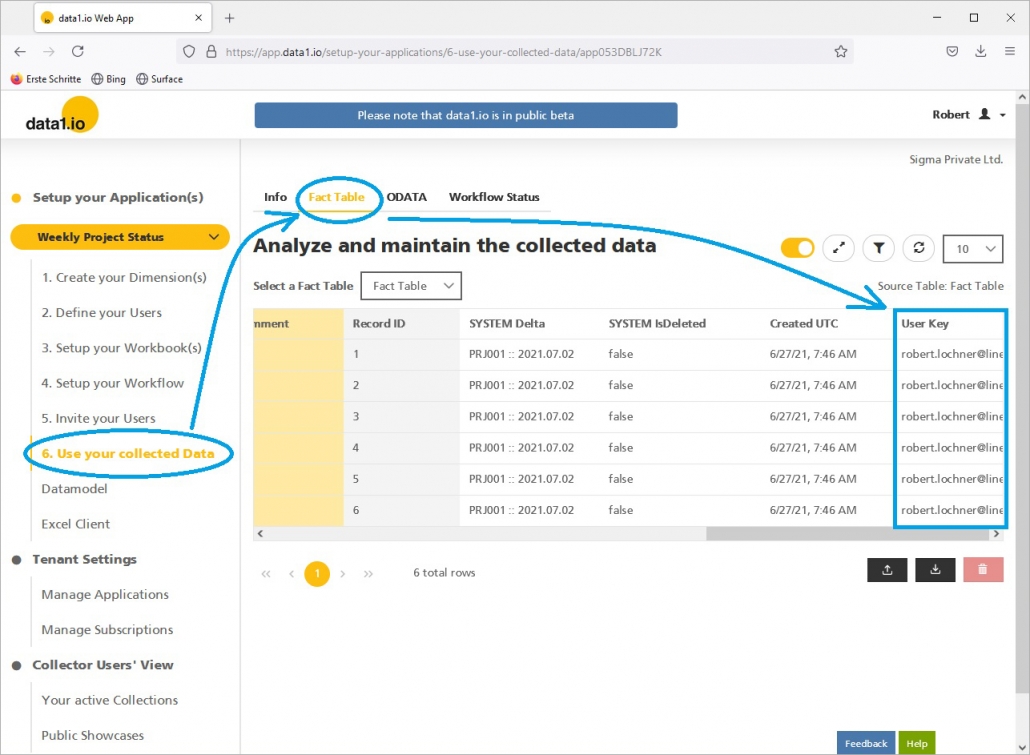
(6) Web App: New column USER_Key in the Fact Table
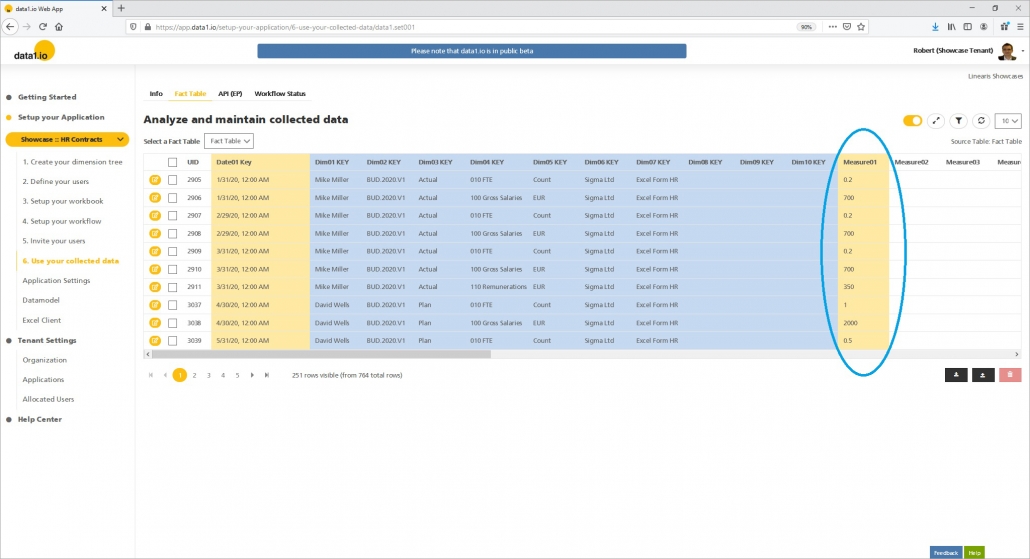
A little but important extension is the new User Key column in the fact table. This makes analysis of the collected data much easier than before:
(7) Web App: License information for Enterprise Plan
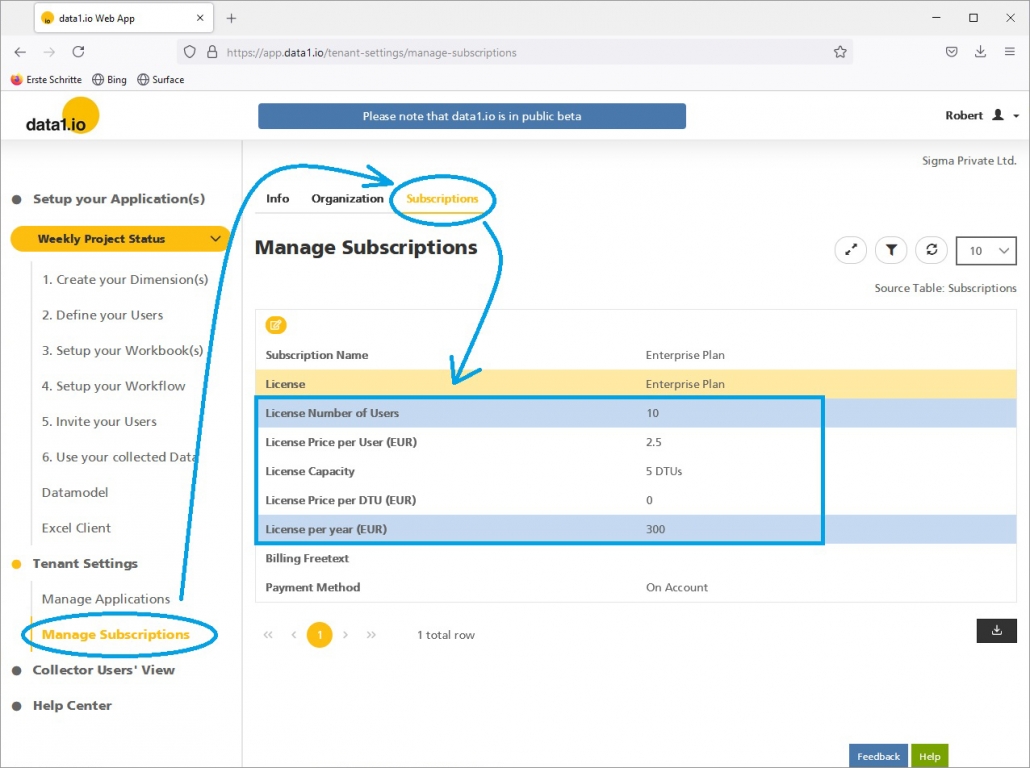
As an Enterprise Plan user you can see now your personal license informaton in your Tenant Settings:
Please note that at this stage it is not possible to change license settings by your own.
(8) Further Improvements
We have improved the default sort order of the tables and have set the default time to “00:00 AM” when entering a date without time. Futhermore we have solved some minor buts with the workflow e-mails.
(9) Removal of the “Public Beta” bar
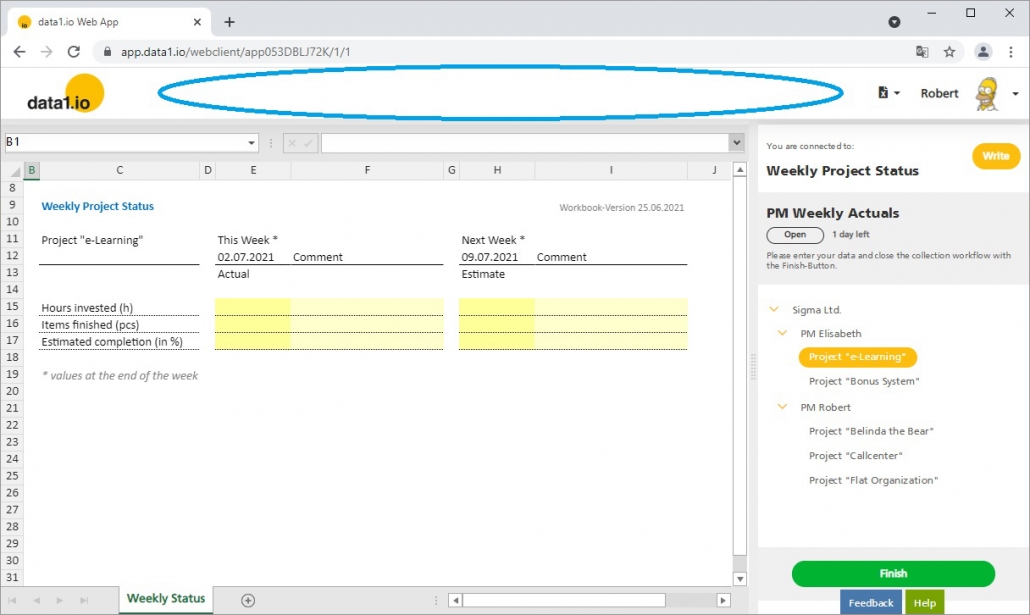
Since data1.io is “Generally Available” now we removed the “Public Beta” at the top of the Web App and the Web Client:
Hope you like the new features – we are very curious about your feedback! Please let us know what you think and what kind of collection processes you would prefer to automate with data1.io.
And: stay healthy!
https://data-one.cloud/wp-content/uploads/2021/06/June-2021-Release-Title.jpg200400Robert Lochnerhttps://data1.io/wp-content/uploads/2021/06/data1.io_Logo_Black-Orange-184-x-300-300x184.pngRobert Lochner2021-06-28 16:42:472021-06-29 21:31:28Release June 2021
We are happy to deliver the brandnew May 2021 release with the new editable Dimension Tree and the new Power BI Custom Visual Prototype. Try it now!
Remember, the Web Client is the user friendly spreadsheet for your Collector Users to deliver their monthly/weekly/daily data. The Web App is the tool for the Power User to setup and control your organization’s collection workflows.
(1) New editable Dimension Tree: Collector User view
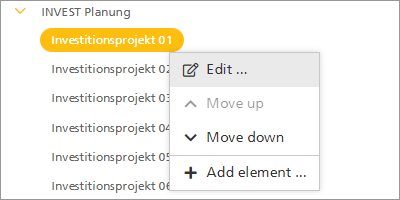
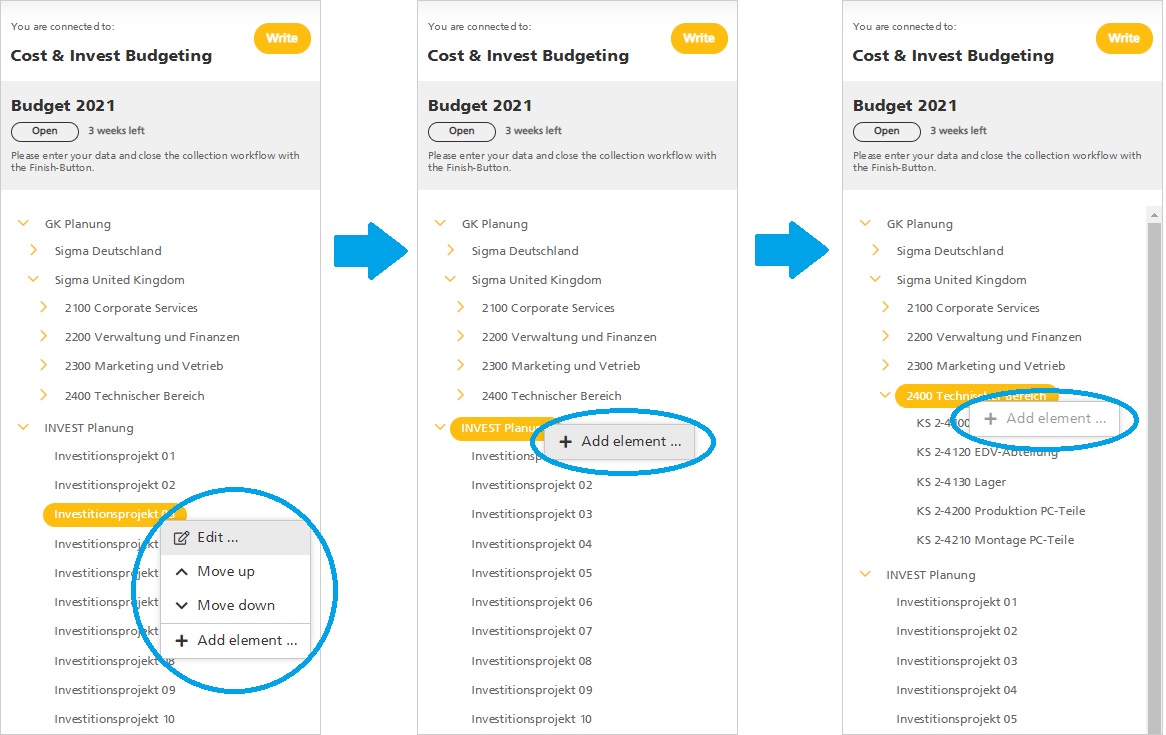
From now on it is possible that your Collector Users can create new elements in the dimension tree! More exactly, the bottom level elements in the dimension tree can be edited by users, who get the “create” right. You`ll find the edit dialog as kontext menu on the dimension tree elements on the bottom level as well as the elements on the penultimate level: in both cases the element is created on the bottom level. If the user does not have the right to edit the dimension tree (or parts of it) then the edit dialog is disabled:
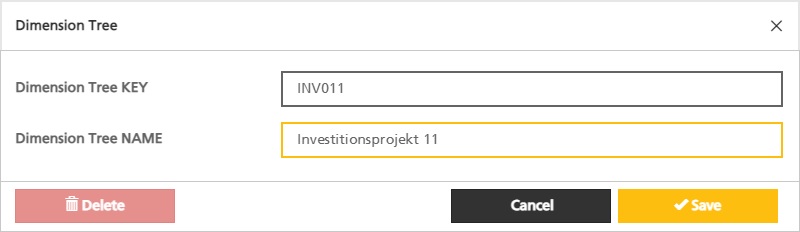
The creation of a dimension tree element needs the entry of two information: the key and the name of the element:
If the dimension key already exists then the element will not be created. After the element was created only the name (and not the key) can be edited. Please be aware that this feature is very mighty and therefore your users have to be instructed how to define keys and how to use the delete function.
(2) New editable Dimension Tree: Power User view
The editable dimension tree will not be relevant for every data1.io application, threrefore the dimension tree is by default NOT editable (as it was until now). If you want to activate this new function, you do that on a workbook level:
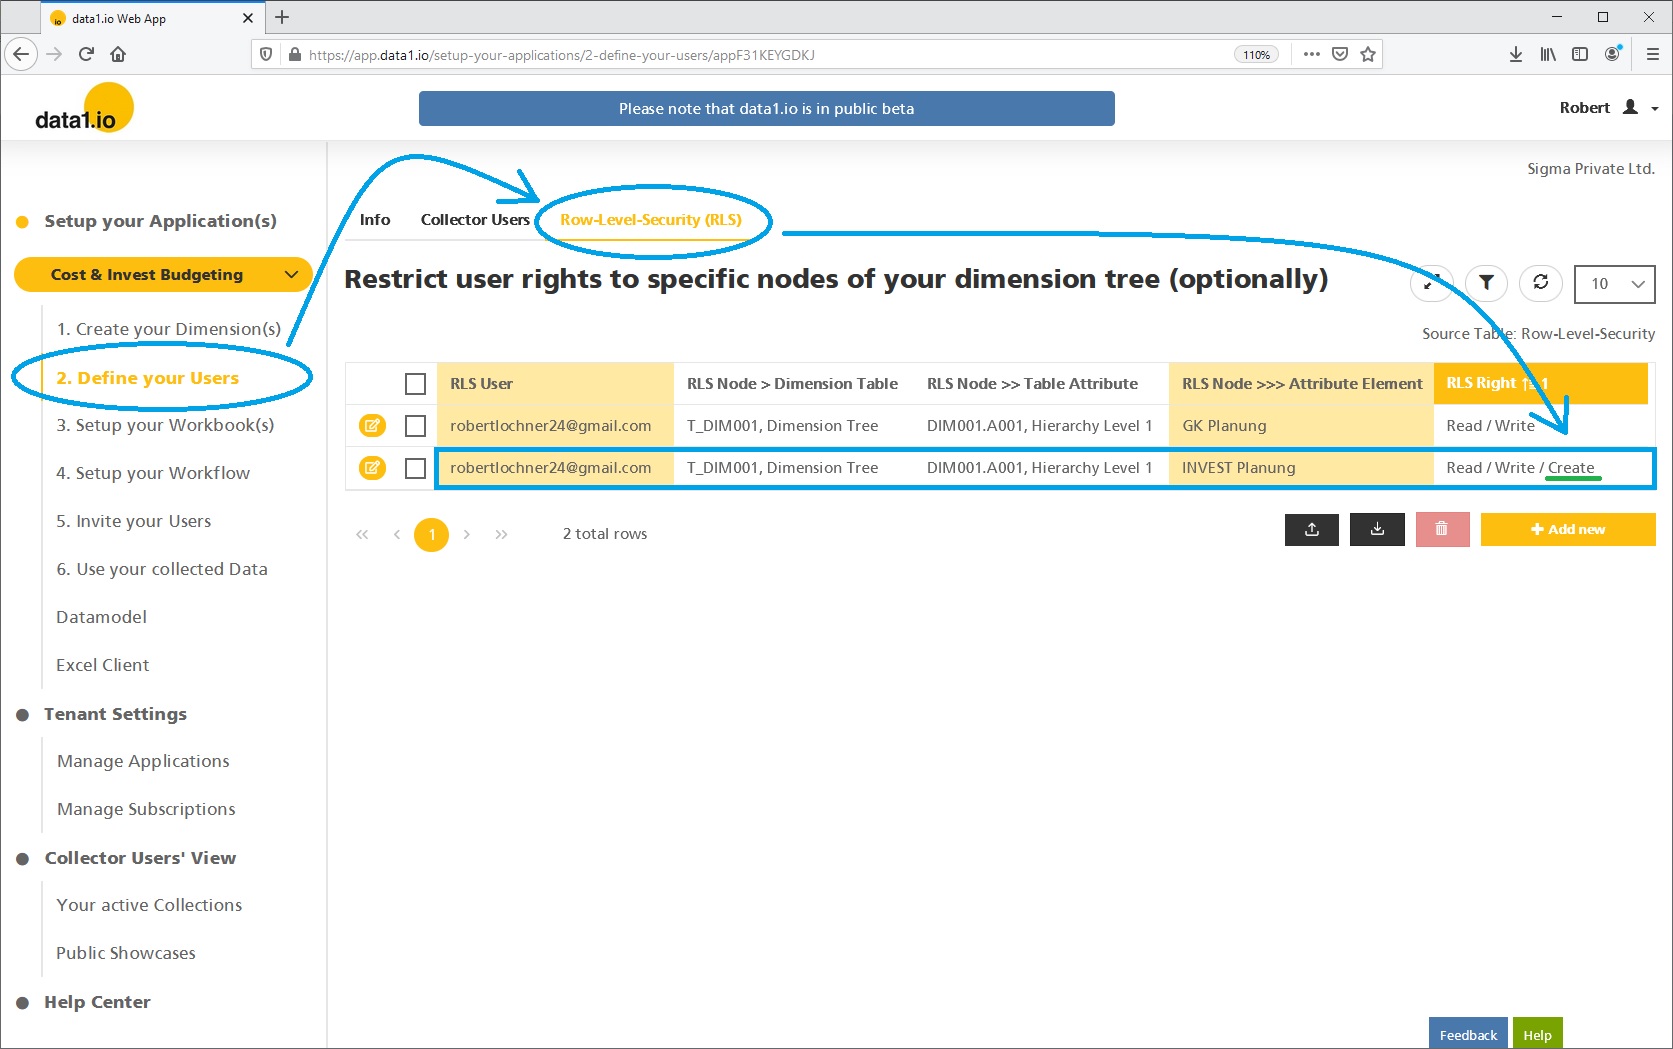
On a more detailled level, the user-specific definition for the whole dimension tree or only for branches of the dimension tree ist set via the new “create” right in the Row Level Security definition:
(3) New Showcase: “Weekly Cash Planning” (in German)
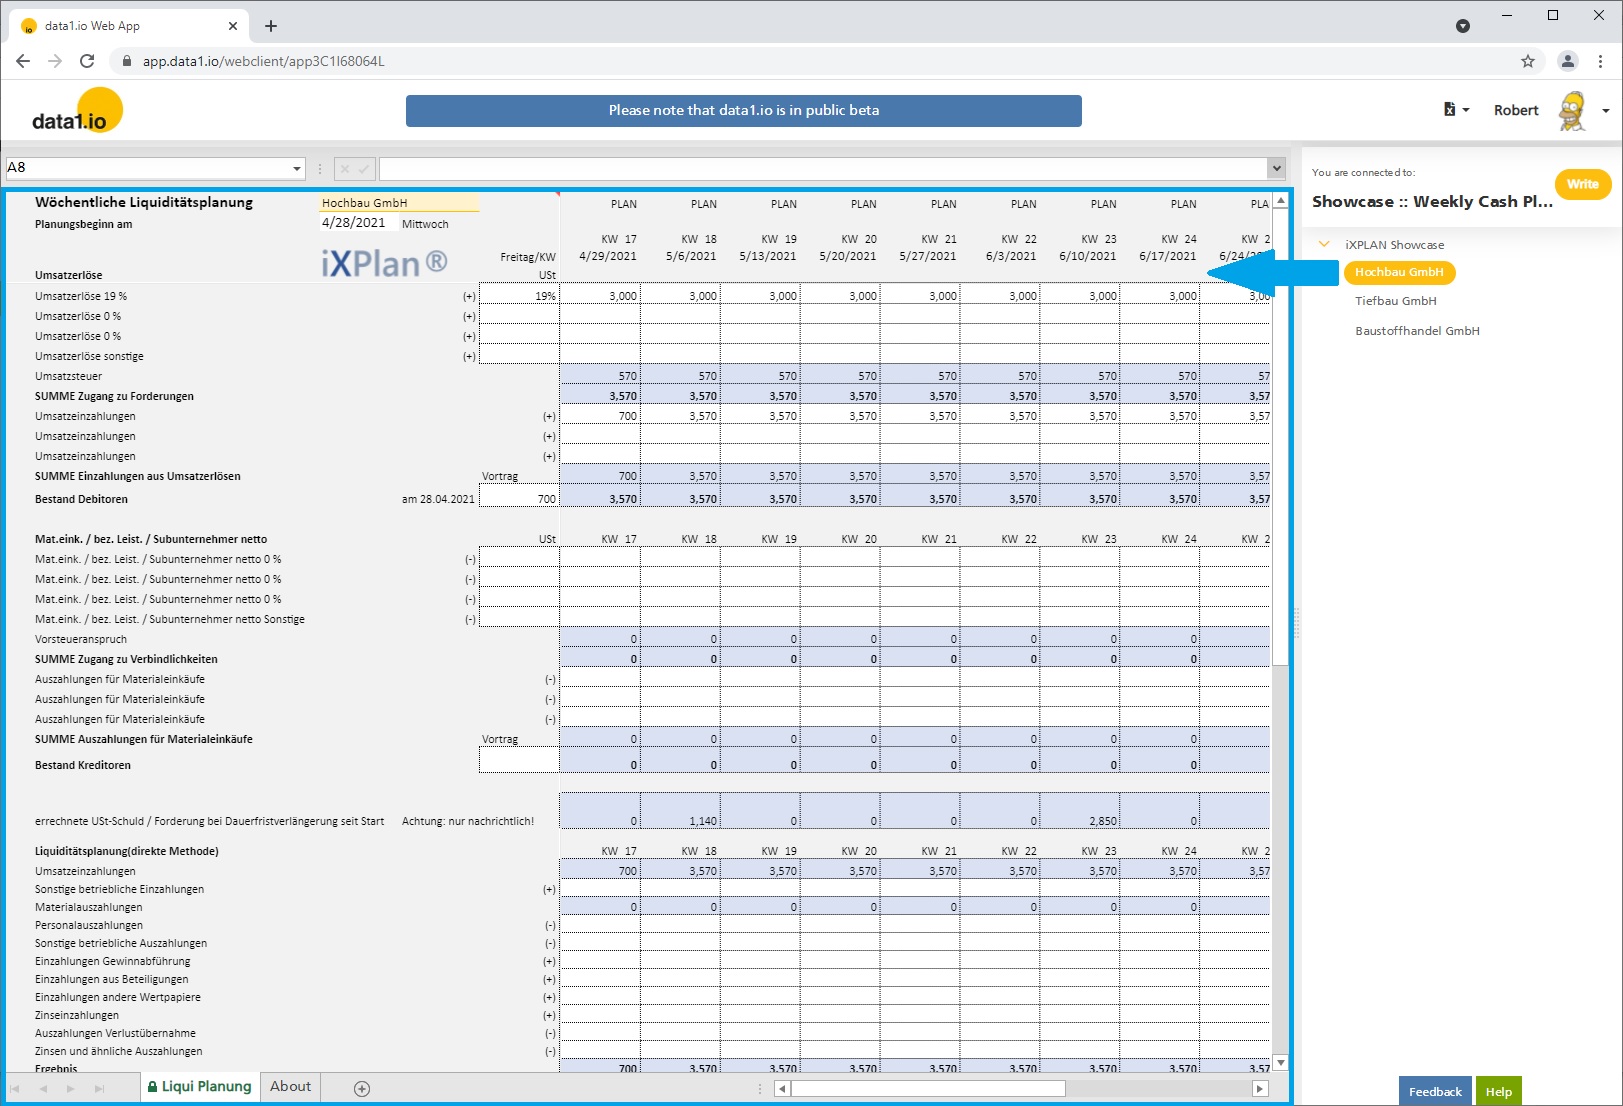
We are happy that we have the “Weekly Cash Planning” as our 7th Public Showcase:
The showcase demonstrates how the logic from the established financial planning tool “iXPlan” can be used within the data1.io service to collect cash planning information e.g. from several companies:
If you are interested to use this solution for your own company please contact Mr. Pfitzer from Pfitzer Consult in Coburg / Germany:
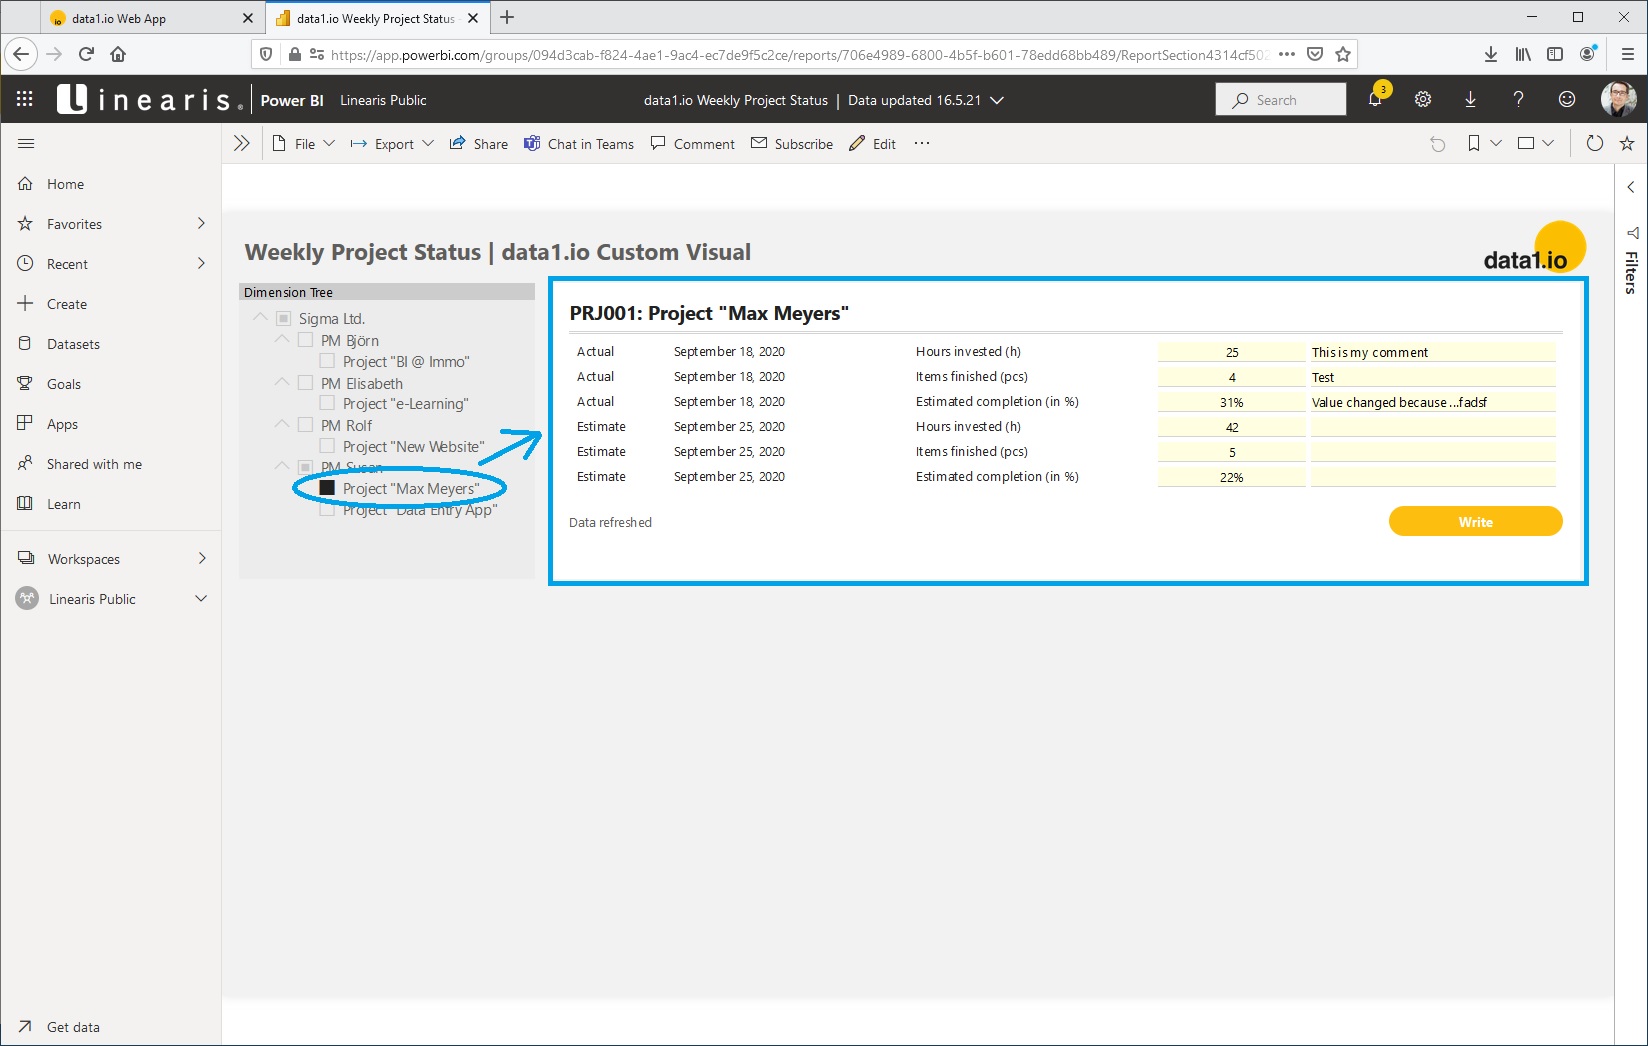
(4) Power BI: New Custom Visual (Prototype)
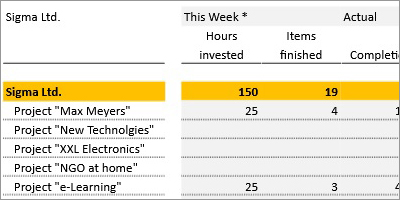
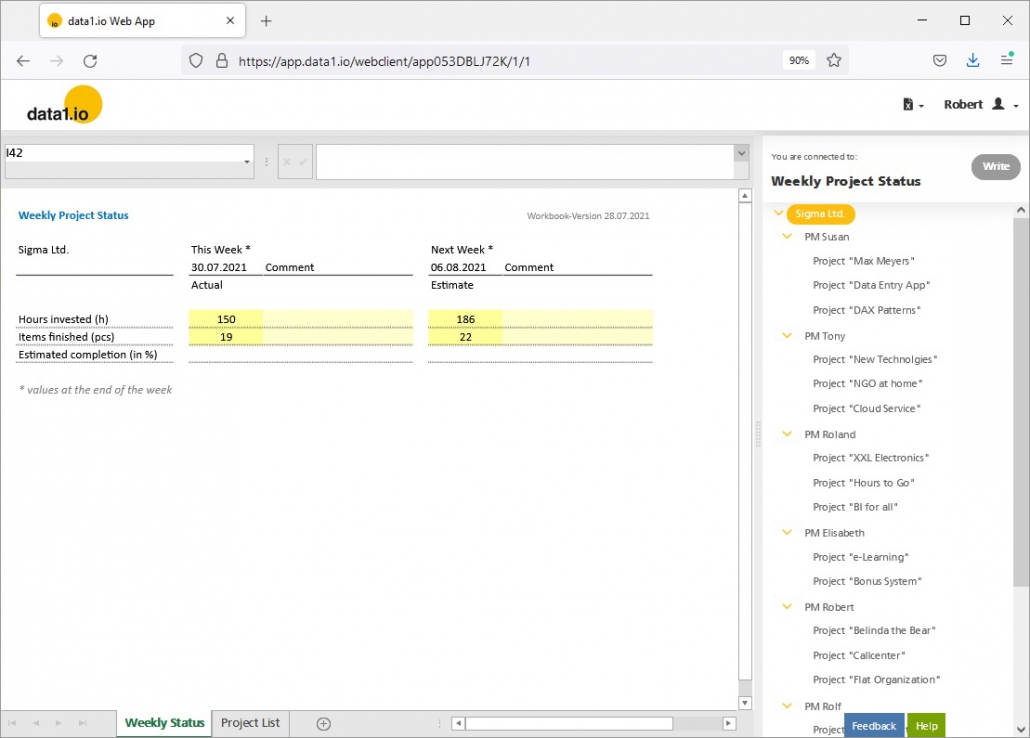
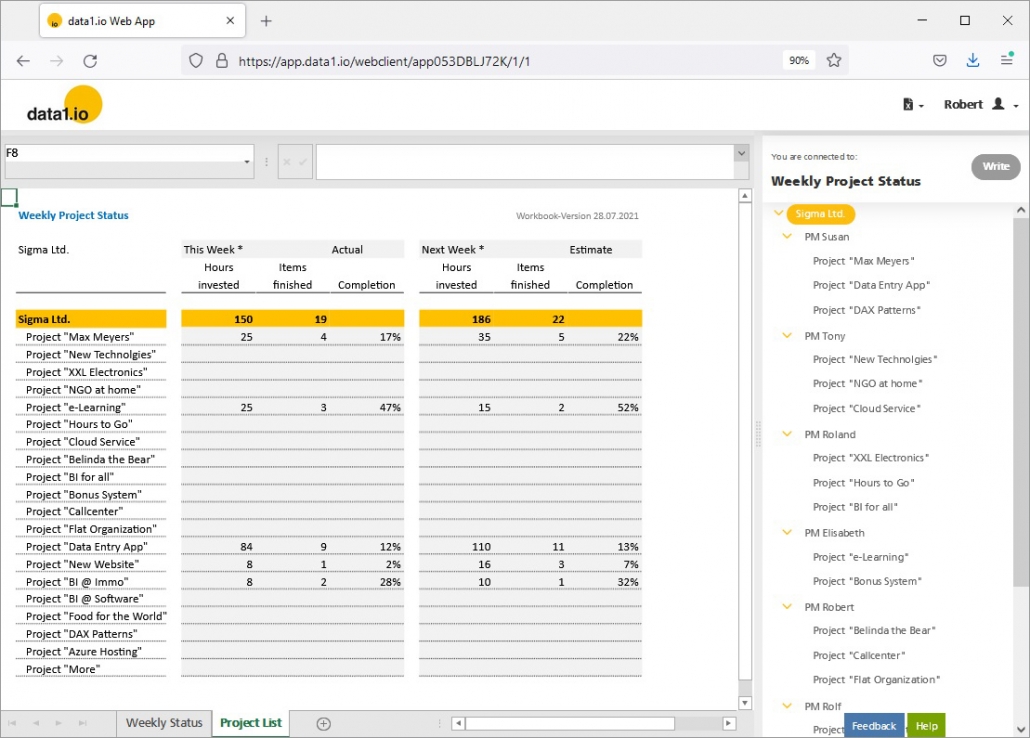
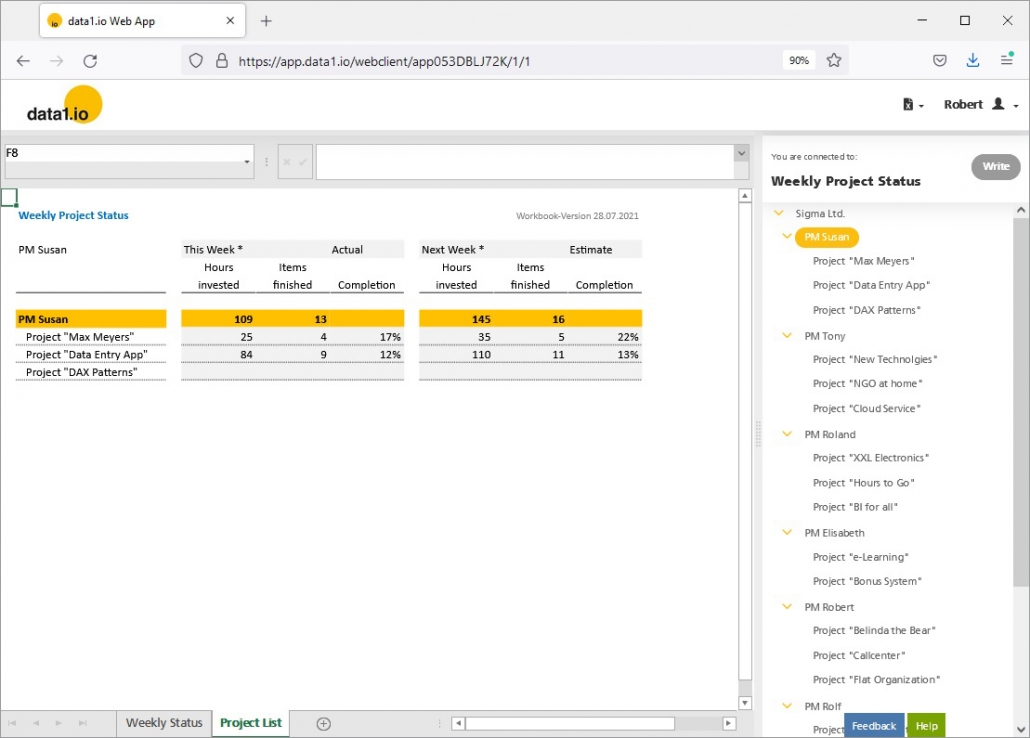
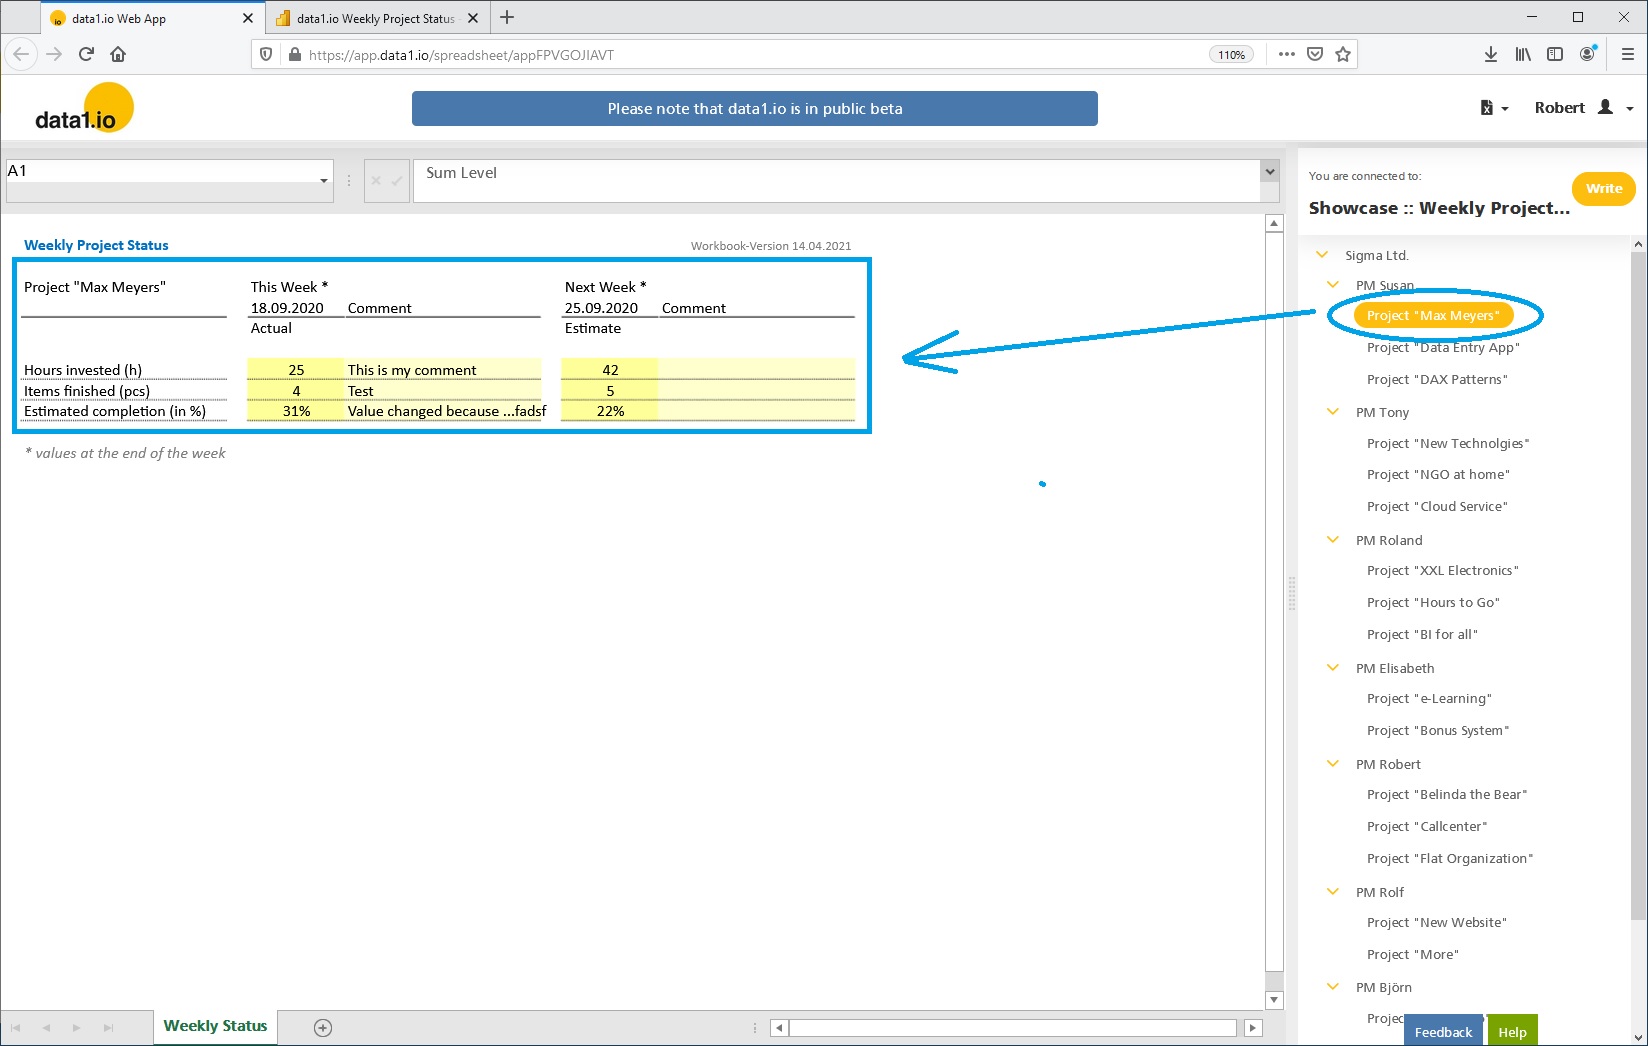
We are really proud that we can show with our existing public showcase “Weekly Project Status” …
… how data1.io collections could look like with a Power BI Custom Visual:
Please note that this is a prototype in order to test the feasibility. If you as a company are interested in this technology please feel free to contact us.
Read also our blogpost – you´ll find there an embedded version of the demo application to test the Power BI Custom Visual in action!
(5) Power BI: New iFrame Embedding for the Web Client (Prototype)
We invested also in another feasibility prototype – namely the embedding of the data1.io Web Client via iFrame e.g. into Power BI:
You can see the iFrame HTML Code in the bottom of the Power BI Page, we used the “normal” custom visual “HTML Viewer” to embed the data1.io Web Client into Power BI. After the login you can use data1.io as you know it directly on a Power BI Page:
If you as a company are interested in this technology please feel free to contact us.
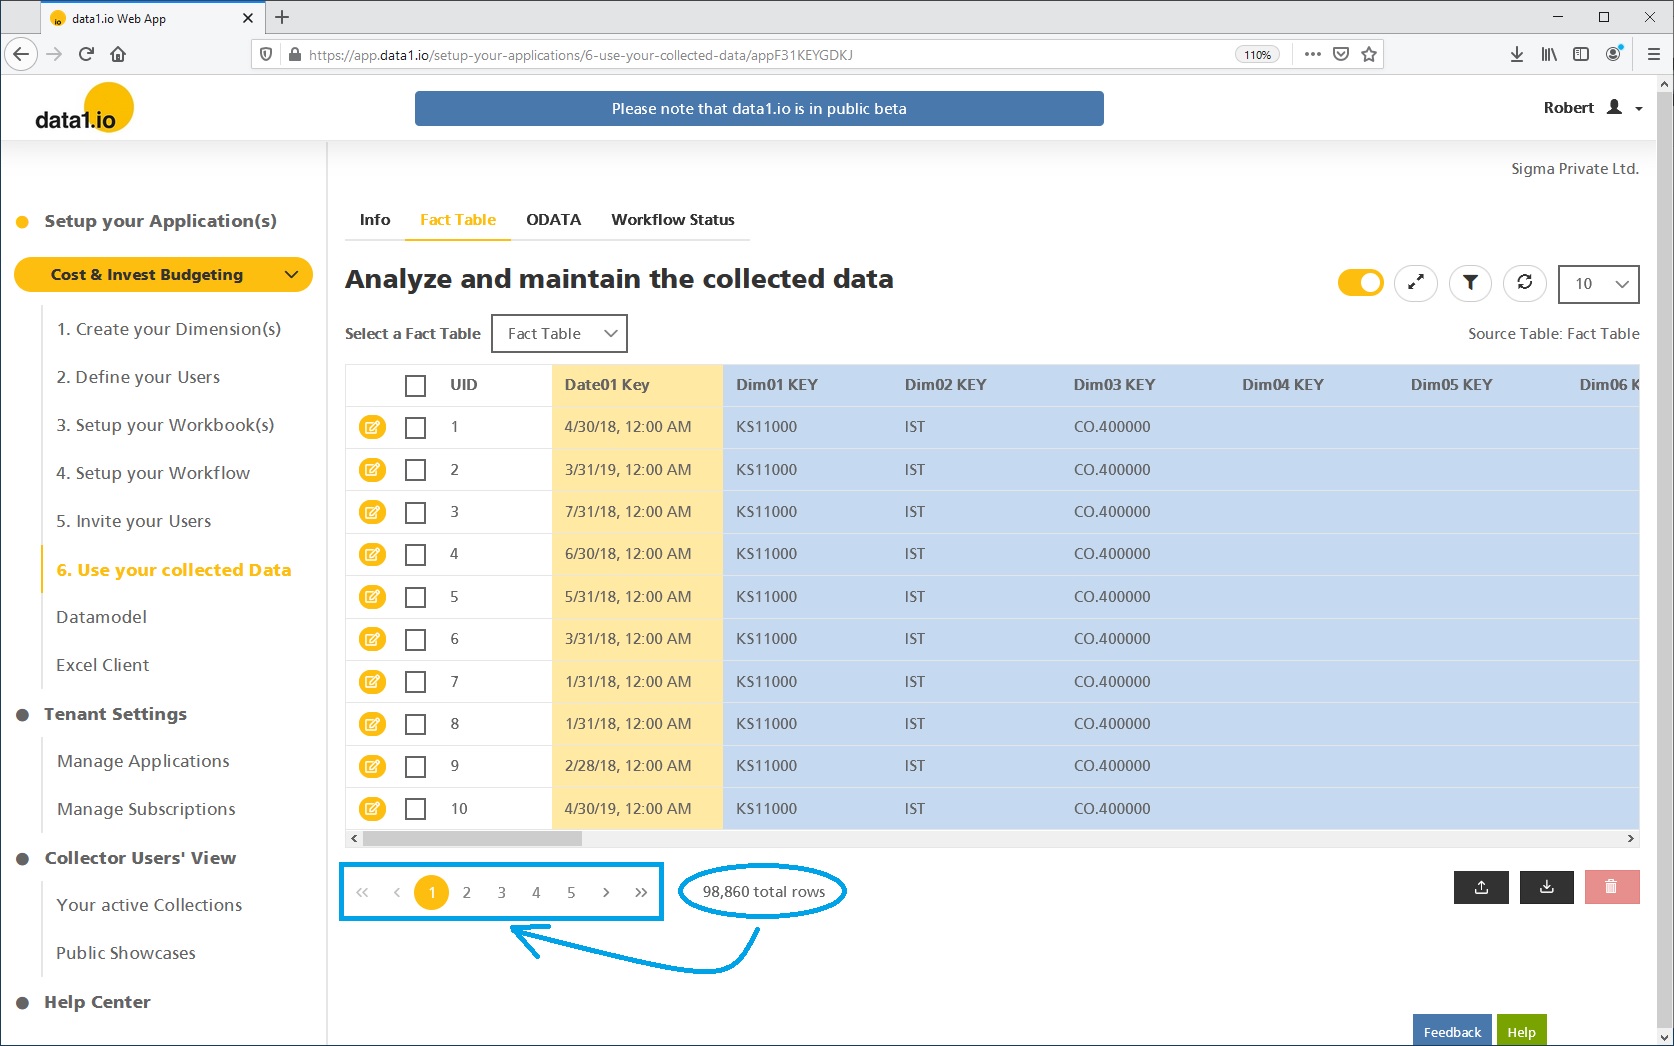
(6) Web App: New paging mechanism for large Tables
Until now it took a long time to load large tables within the Web App. With the new paging mechanism for large tables this issue is solved now:
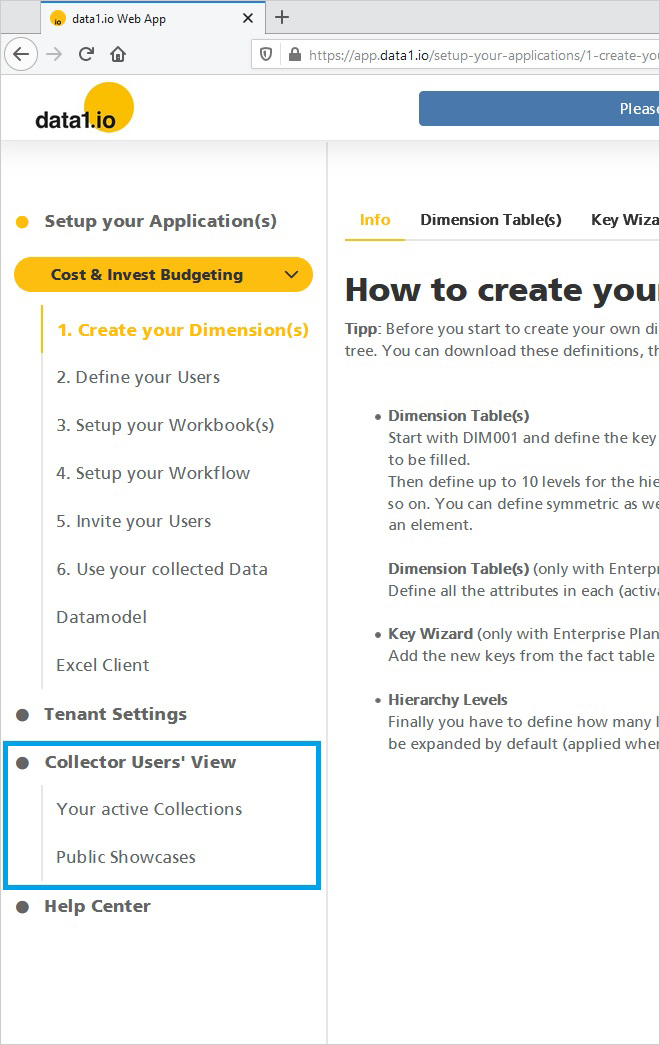
(7) Web App: Change in default Landingpage for Power Users
Until now a Power User was directed to the Web App and it was difficult to navigate to the “Collector Users`Landingpage” as a Power User. Vice versa, a Power User who has also (in another application) a Collector User role was directed to the “Collector Users`Landingpage” and it was difficult to navigate to the Web App.
We have changed that now. A Power User is directed now always to the Web App and we added in the navigation pane on the left the links to the “Collector Users’ Landingpage” an to the “Public Showcase Gallery”:
Definition: a Power User is a user who either has a Tenant Admin role or an Application Owner role.
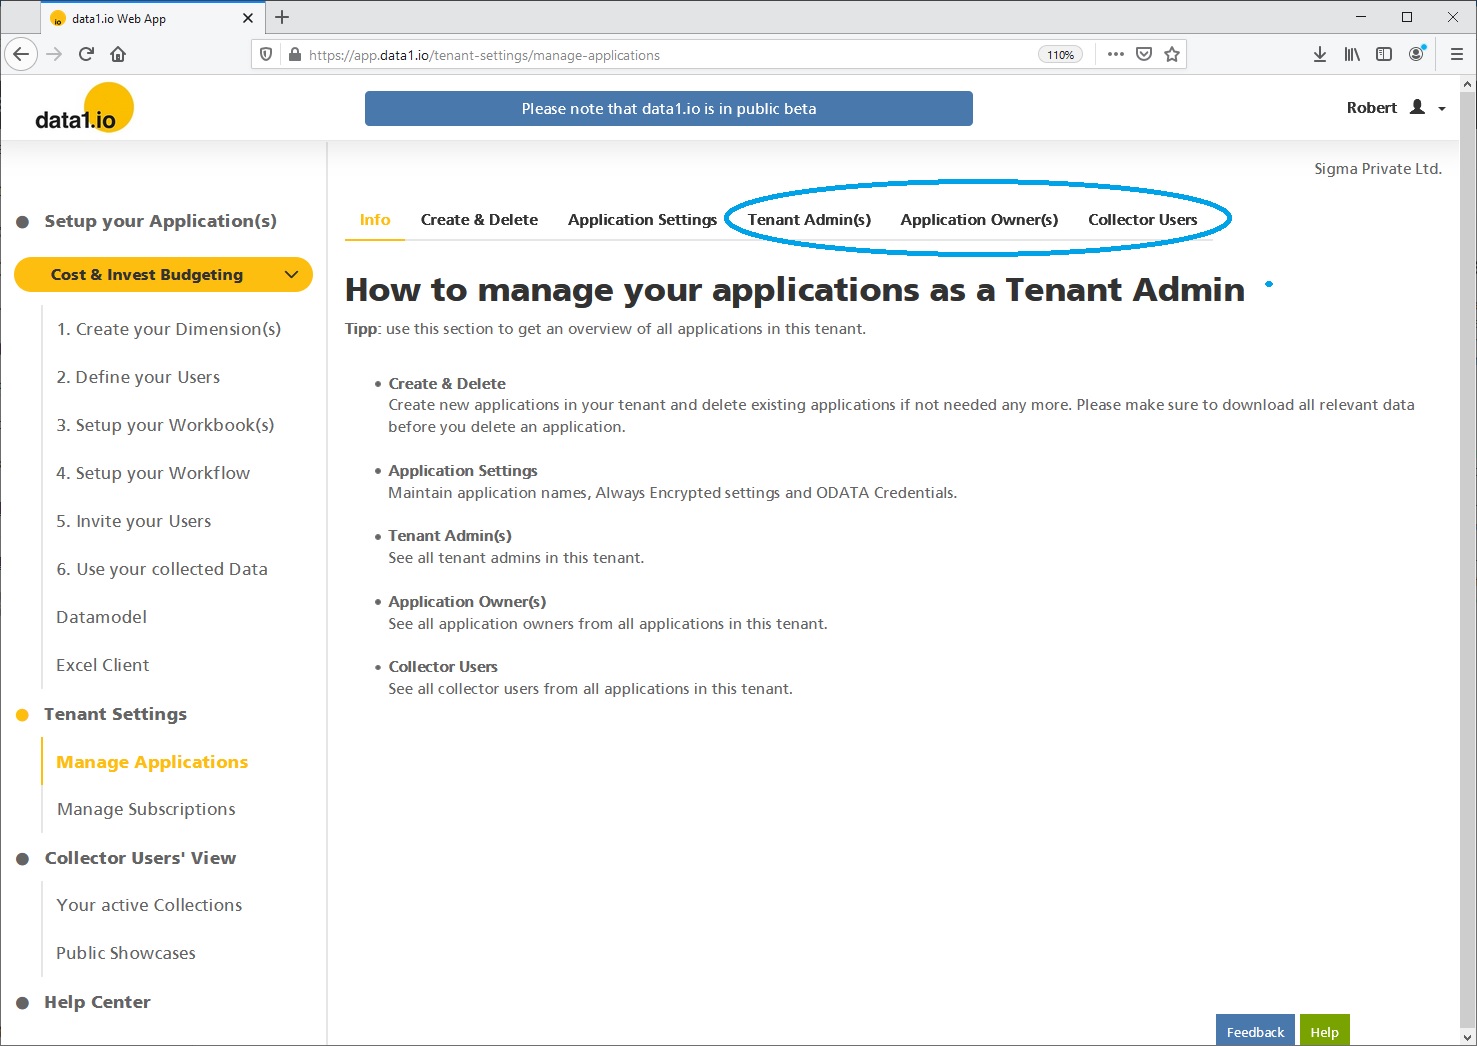
(8) Enterprise Plan: User Interface finished
We are happy that we have finished the User Interface for Companies / Users with an Enterprise Plan. We have checked and streamlined all screens, dropdowns, etc. to make the maintenance of the Enterprise Plan features as efficient as possible. Furthermore we added new tabs for the different user roles in your tenant:
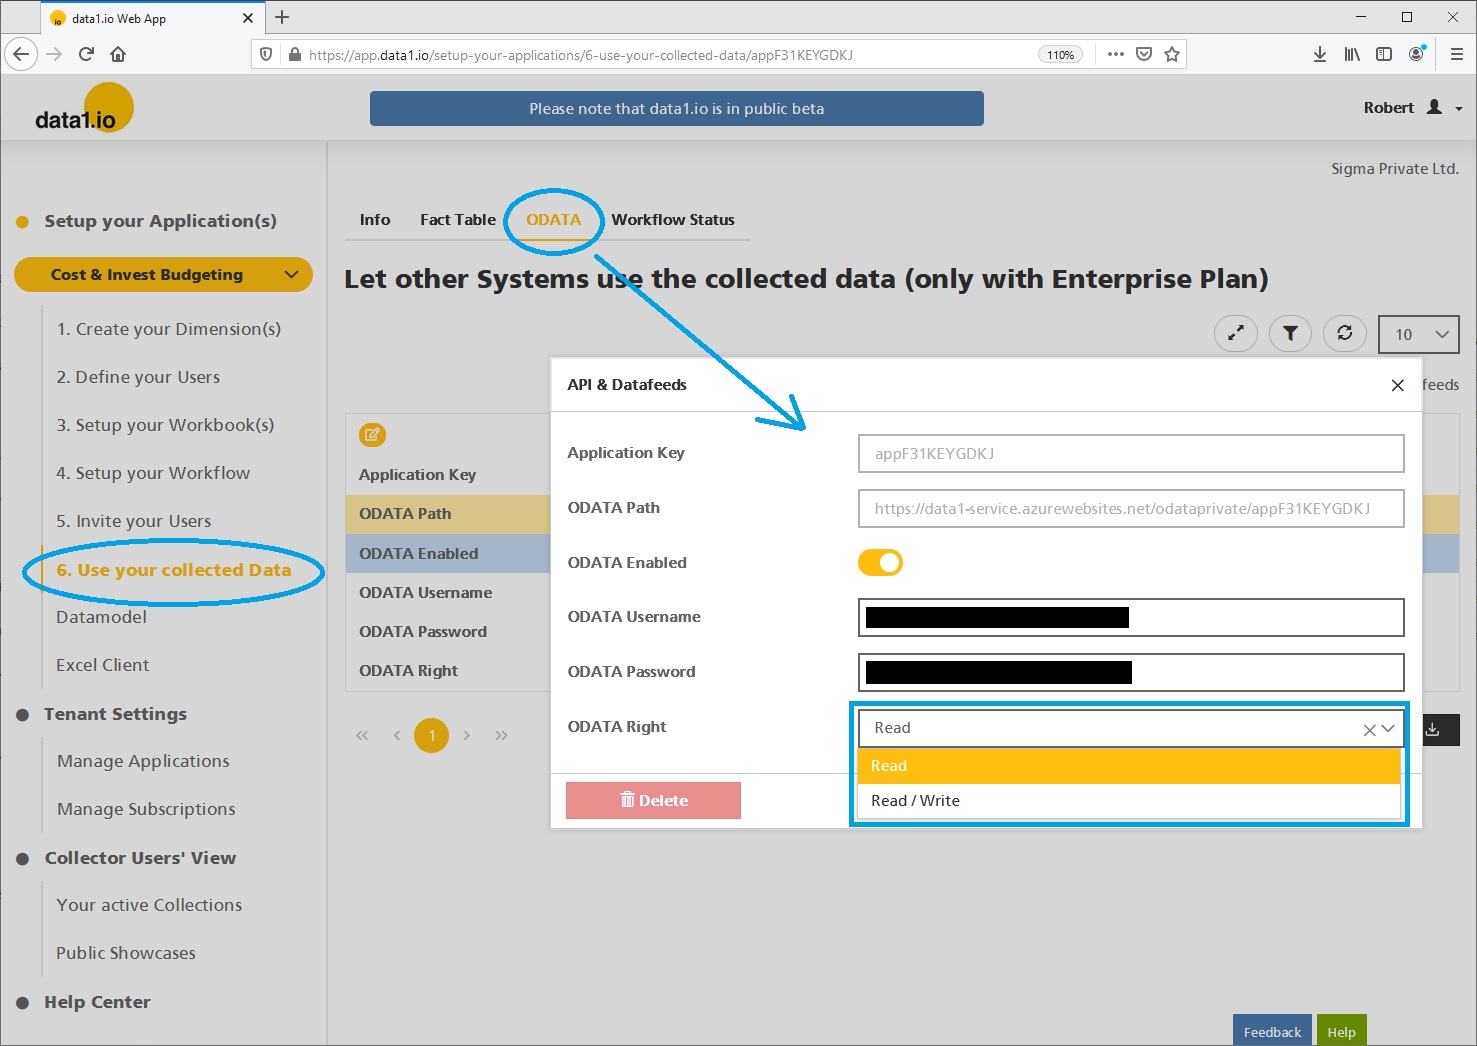
(9) Enterprise Plan: New ODATA rights
Until now the private ODATA feed was always enabled for both read and write. From now on this can be configured on an application level and we recommend to set the “read” right since this will be sufficient for the most use cases:
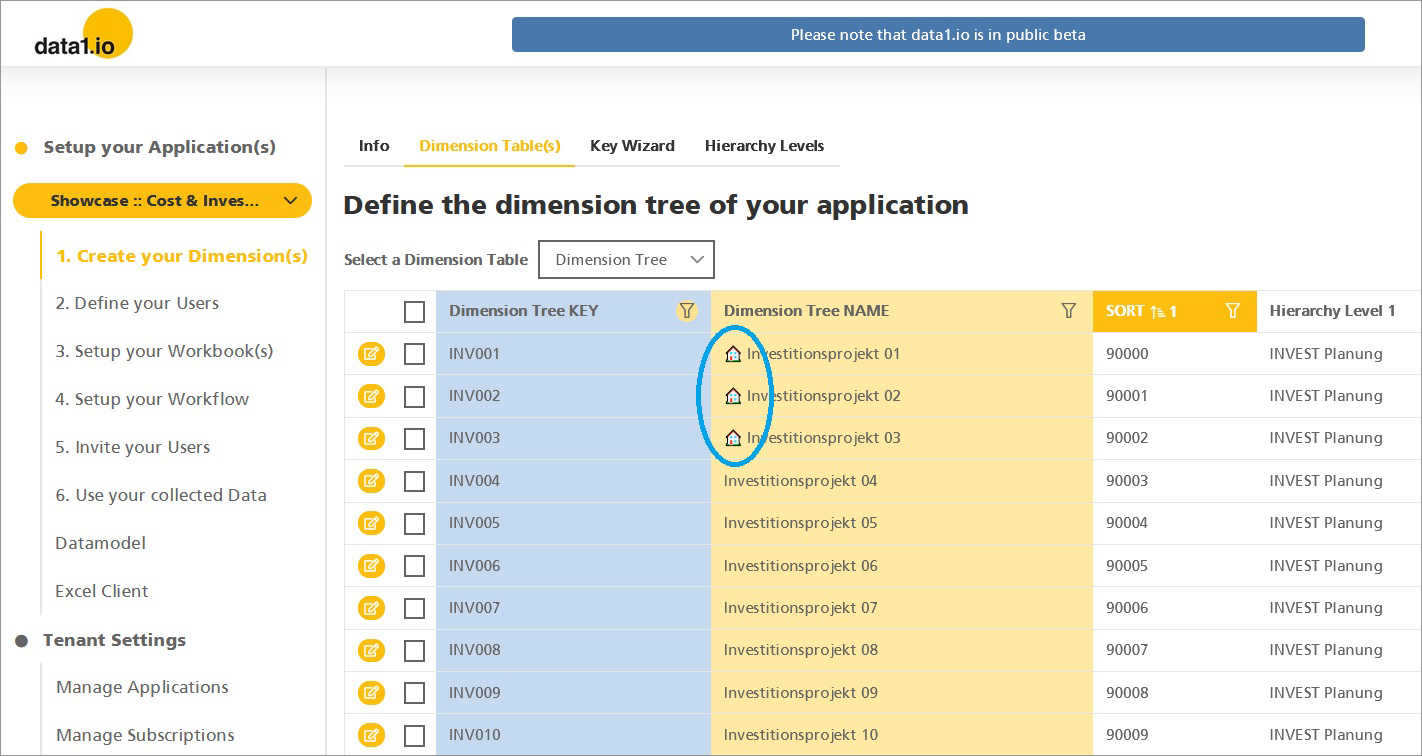
(10) Tipp: Use icons in the dimension tree
One of our users showed us that it is possible to add UTF-8 symbols to the name of the dimension tree elements – which can make the dimension tree more friendly and more intuitively:
Simply add the UTF-8 Symbol to the Dimension Tree NAME:
Hope you like the new features – we are very curious about your feedback! Please let us know what you think and what kind of collection processes you would prefer to automate with data1.io.
And: stay healthy!
https://data-one.cloud/wp-content/uploads/2021/05/May-2021-Release-Title.jpg200400Robert Lochnerhttps://data1.io/wp-content/uploads/2021/06/data1.io_Logo_Black-Orange-184-x-300-300x184.pngRobert Lochner2021-05-28 17:45:192021-05-30 23:41:08Release May 2021
We are happy to deliver the brandnew April 2021 release with the new Multi-Workbook feature and new Enterprise Planfeatures. Try it now!
Remember, the Web Client is the user friendly spreadsheet for your Collector Users to deliver their monthly/weekly/daily data. The Web App is the tool for the Power User to setup and control your organization’s collection workflows.
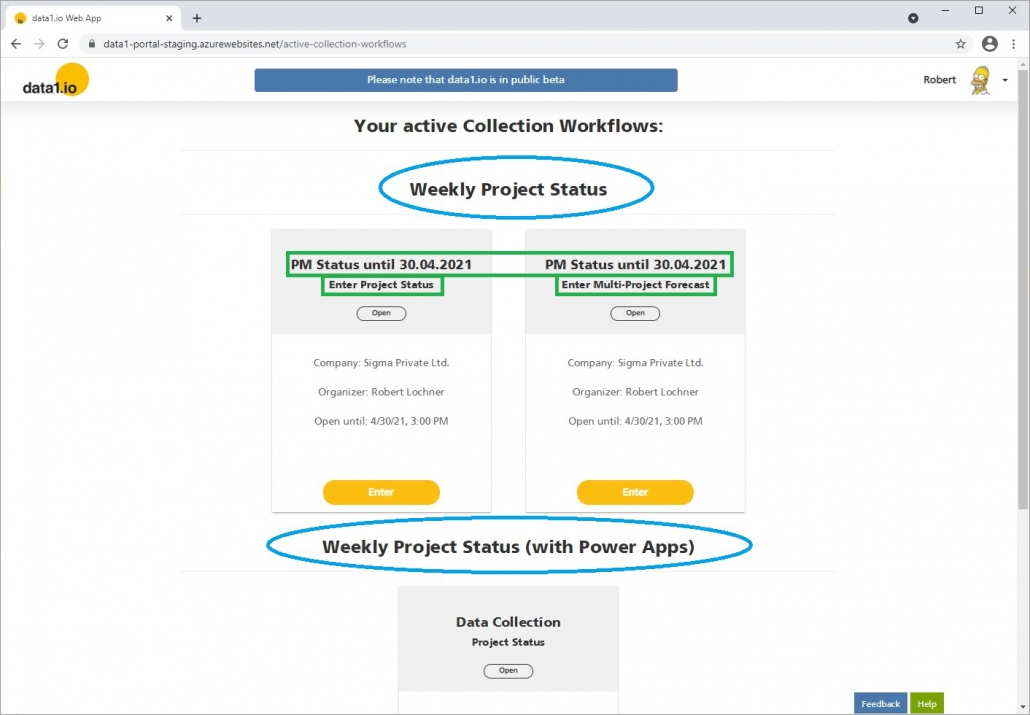
(1) New Multi-Workbook Mode: Collector User view
Until now, each application could have only one workbook (for data entry and/or reporting) …
… with this release we removed this limitation and you can offer as many workbooks to your collector users! The application (“blue”) moved from the tile title to a new segment header and the tile is now titled by the workflow name and the new workbook name (“green”):
From now on it is not necessary any more to put all relevant sheets in one single file and you have now one more tool to design the data entry workflow for your collector users.
(2) New Multi-Workbook Mode: Power User view
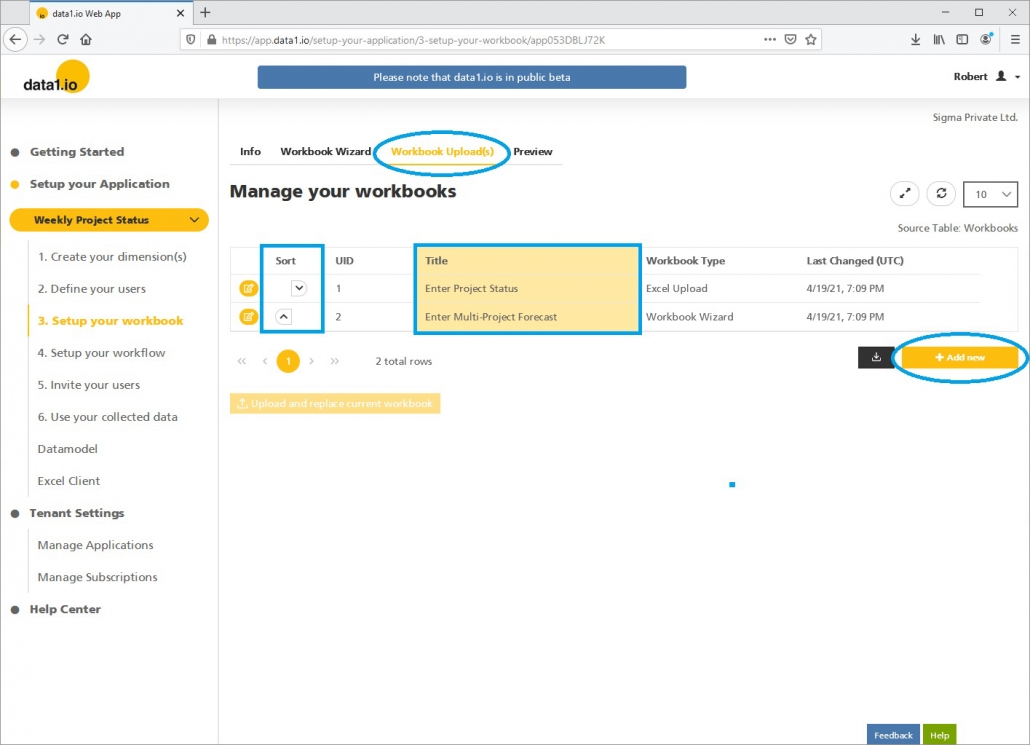
In the Web App you can now upload several Workbooks to your application and define the sort order. Please set proper names for your workbooks since this is the major information for your collector users:
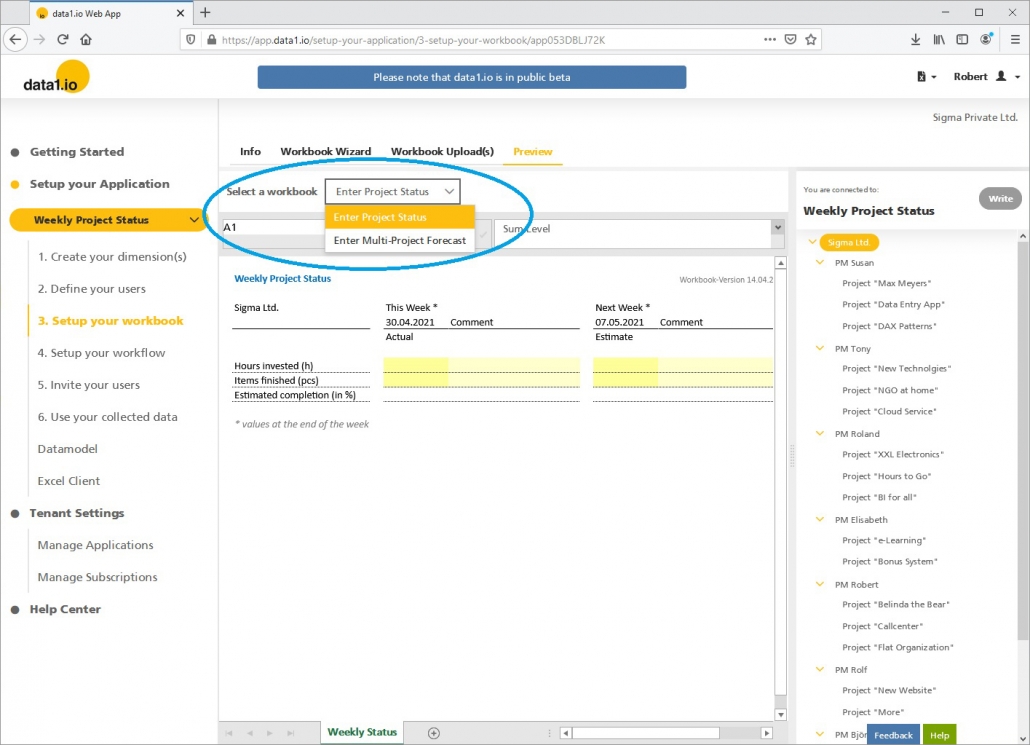
You`ll find new dropdown menus in every section in order to select the right workbook to work with:
(3) Enterprise Plan: Multiple Dimensions
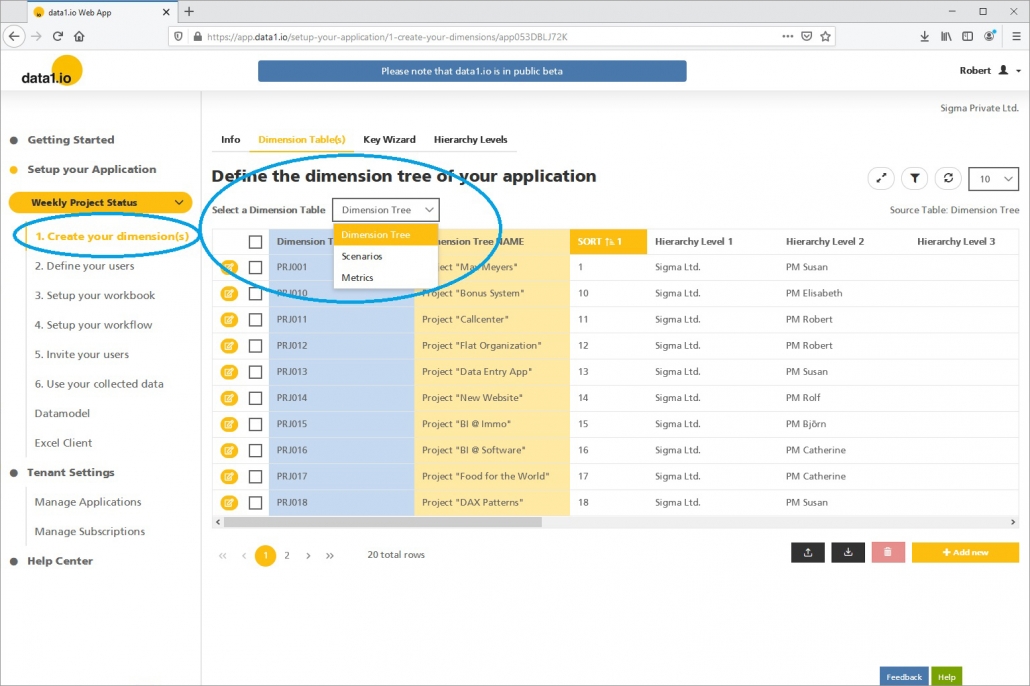
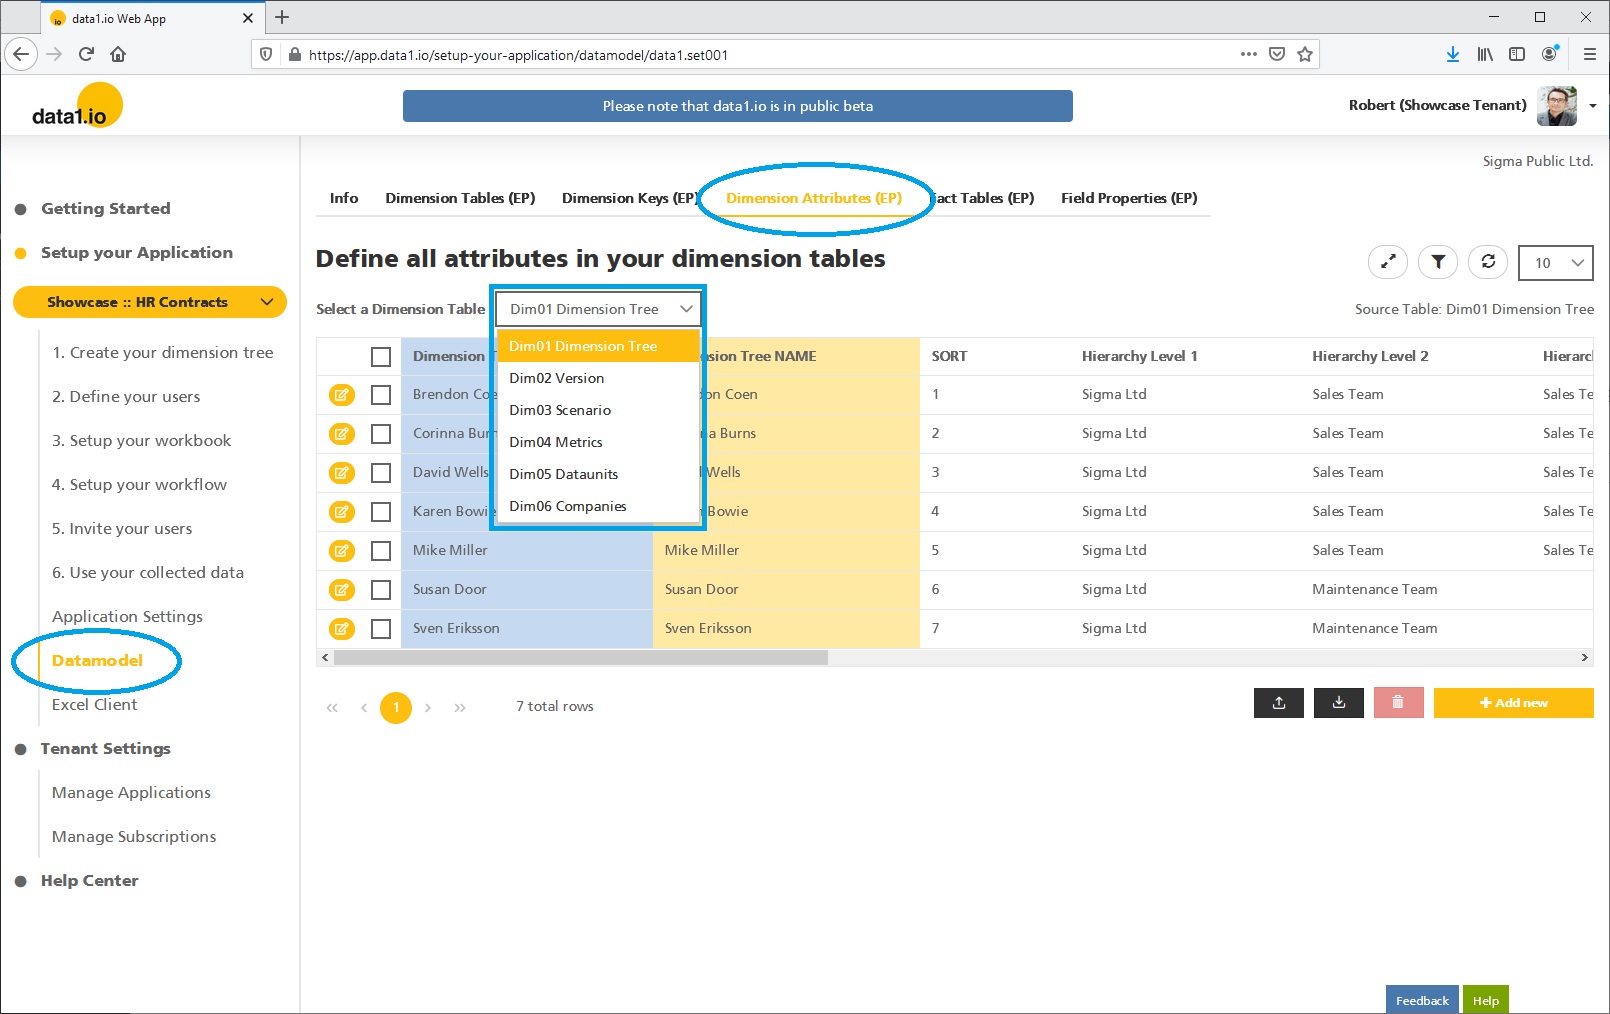
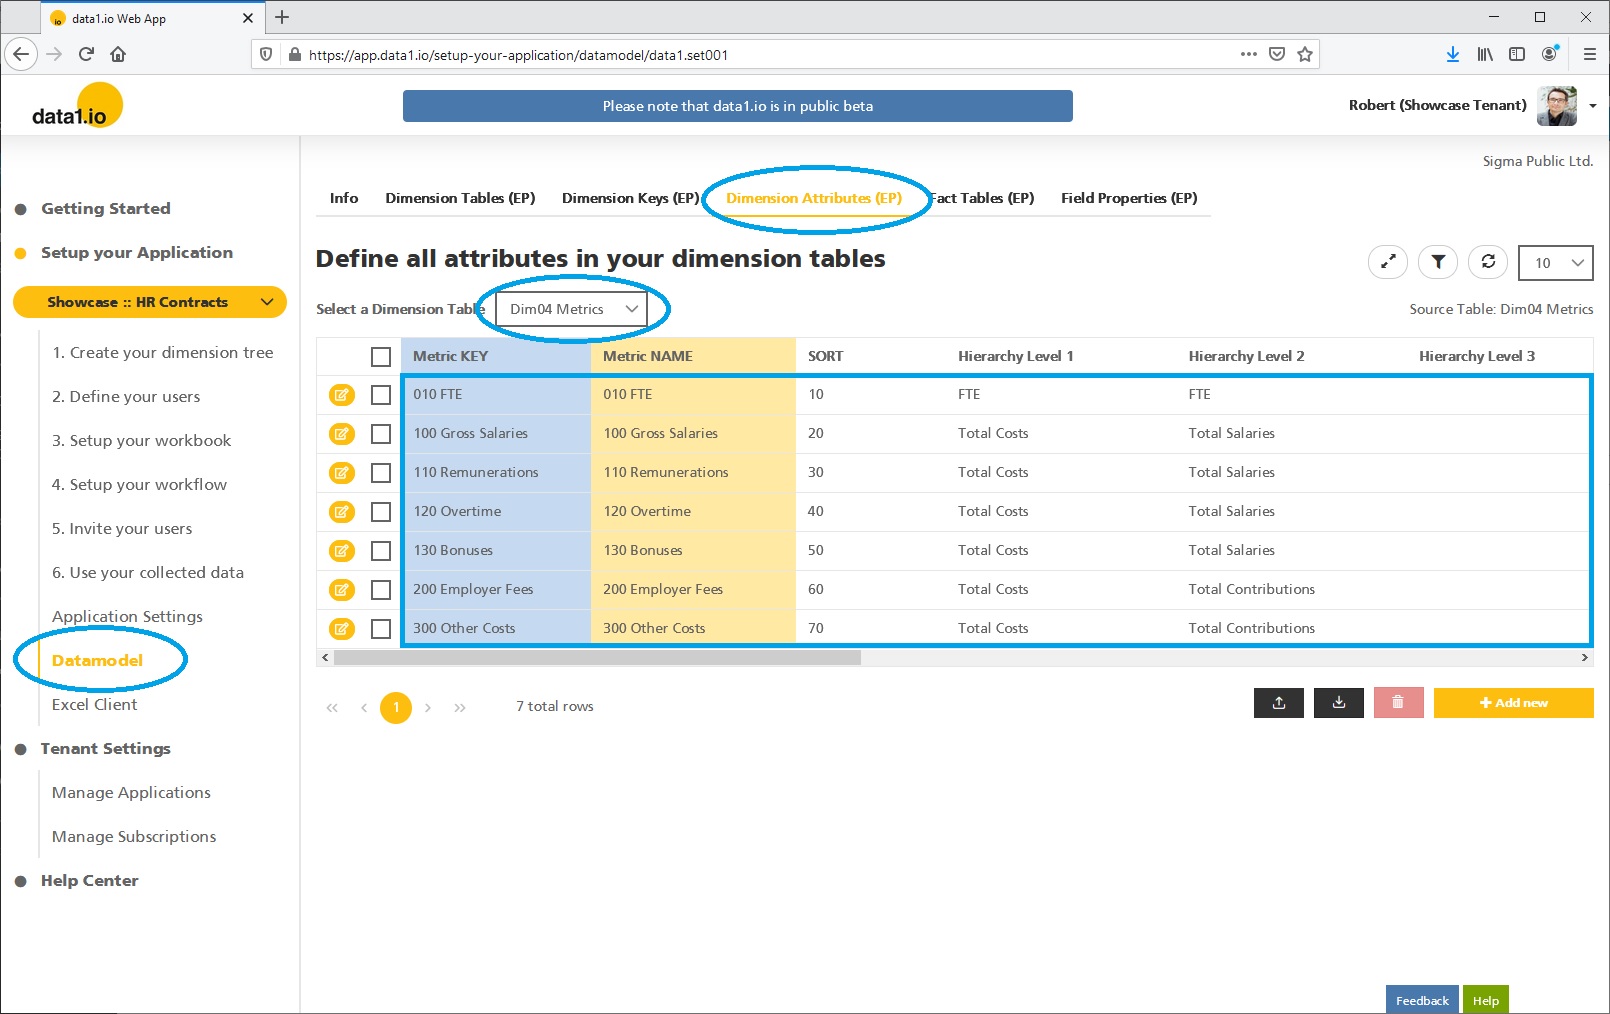
In the November 2020 release we introduced the possibility to activate further dimensions in your datamodel and in the March 2021 release we introduced the maintenance table for this additional dimensions. With this release we decided to fusion this table maintenance with the existing 1. Create your dimension(s) menu item. You`ll find there a new dropdown menu where you can select all activated dimension tables:
Please be aware that the dimension tree for the Collector Users is always generated from the Dimension 01. The further dimensions can be used for aggregations and for external reporting systems like Power BI.
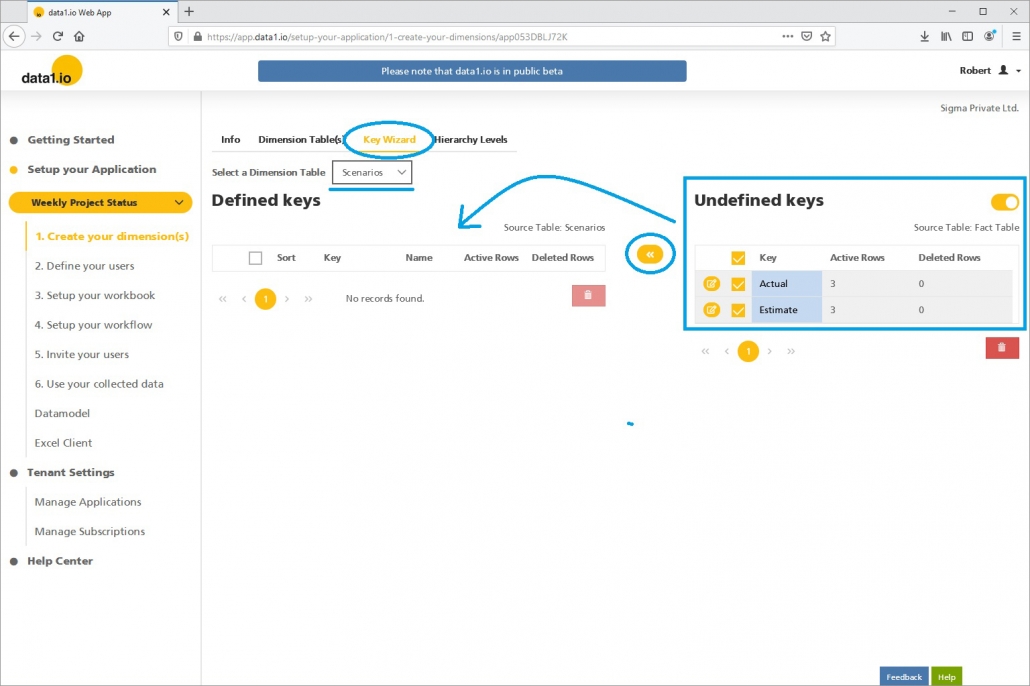
(4) Enterprise Plan: Key Wizard
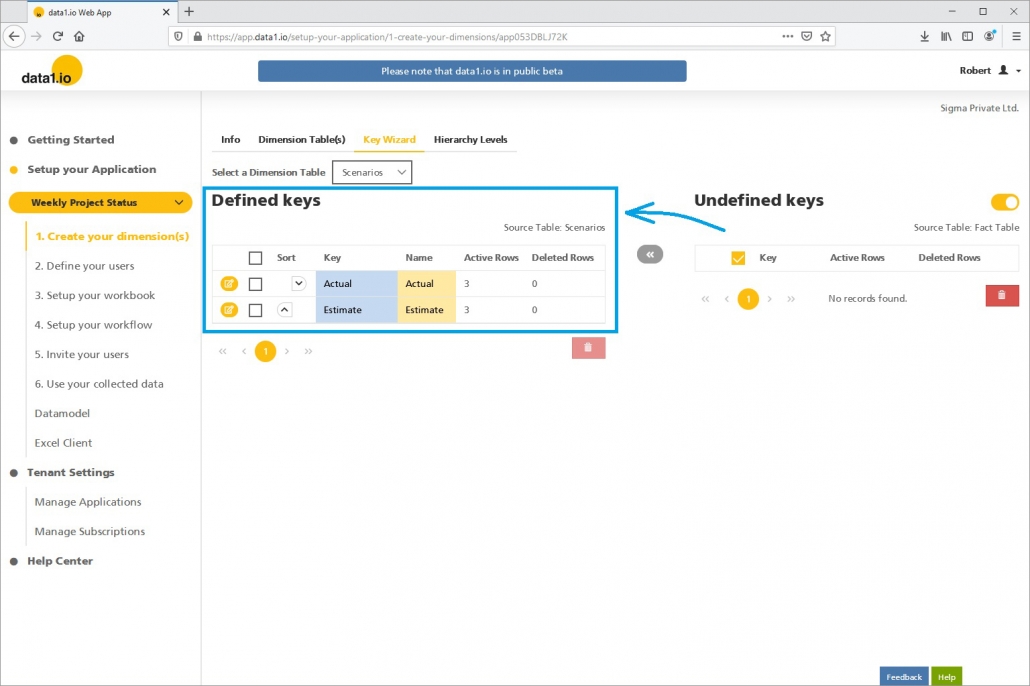
In the same section you`ll find now a new item called Key Wizard. This is a tool which shows you all the undefined keys from the fact table and makes it easy to generate the basic structure of the dimension table …
… by adding those items to the dimension table and make sorting quite easy:
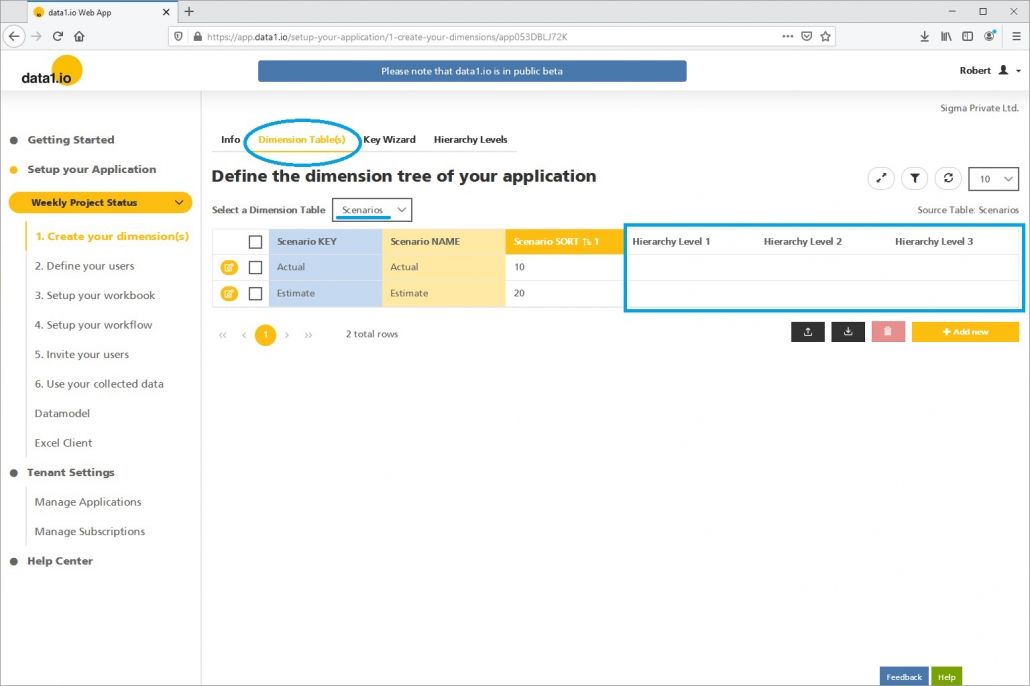
After that you can switch to the regular dimension table and add the addtional attributes – or download as csv, fill the table in Excel and upload the readily prepared table into the Web App:
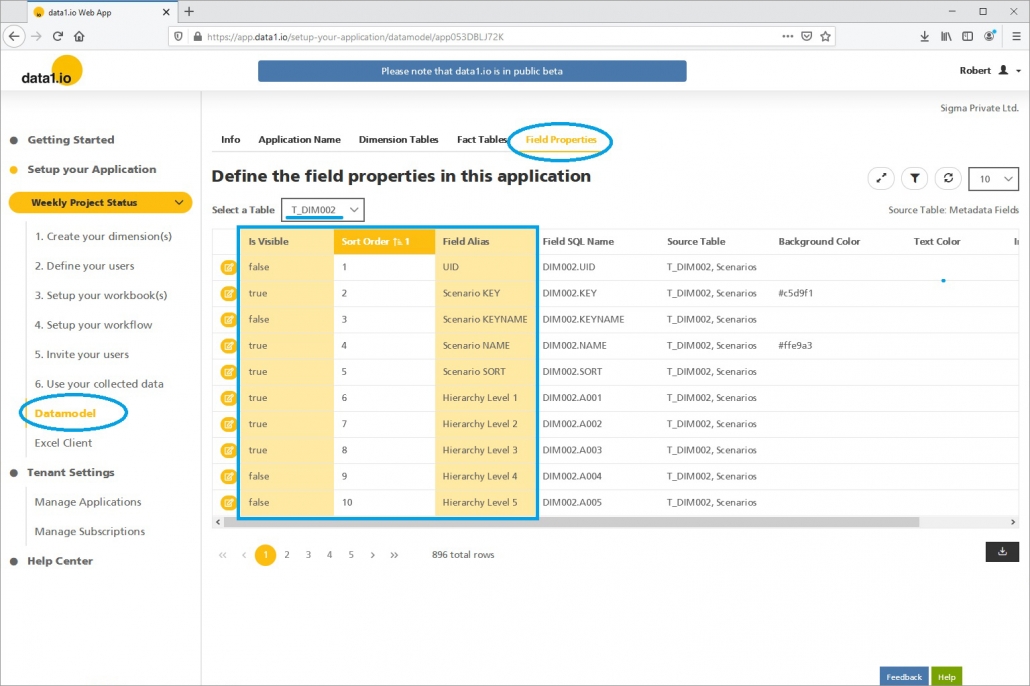
(5) Enterprise Plan: Customize your data model with the field definitions
With this very powerful new feature you can define which fields in each dimension table and also in the fact table are activated (= visible) and especially how this fields are called in your specific application! This is the field definition for the dimesion table “Scenarios” (= DIM002) seen above:
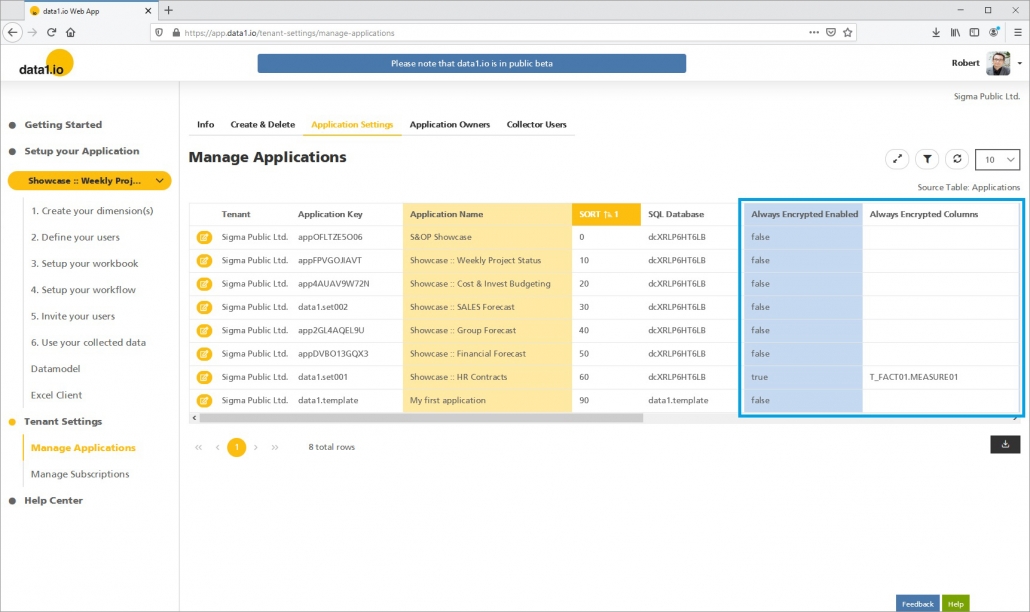
(6) Enterprise Plan: Always Encrypted info columns
We introduced the Always Encrypted feature with the January 2021 release, with this release we add the information, if Always Encrypted is activated in a specific application and if yes, which fields in which tables are encrypted:
Please note that at the moment is not possible to activate the Always Encrypted feature by your own. Please contact us if you want to activate it.
Hope you like the new features – we are very curious about your feedback! Please let us know what you think and what kind of collection processes you would prefer to automate with data1.io.
And: stay healthy!
https://data-one.cloud/wp-content/uploads/2021/04/April-2021-Release-title.jpg200400Robert Lochnerhttps://data1.io/wp-content/uploads/2021/06/data1.io_Logo_Black-Orange-184-x-300-300x184.pngRobert Lochner2021-04-28 17:32:412021-04-29 00:03:04Release April 2021
We are happy to deliver the brandnew March 2021 release with the new hybrid Power Apps showcase and with many other new features. Try it now!
Remember, the Web Client is the user friendly spreadsheet for your Collector Users to deliver their monthly/weekly/daily data. The Web App is the tool for the Power User to setup and control your organization’s collection workflows.
(1) New Power Apps Demo for hybrid scenarios
In the June 20202 release we introduced the “By Cell” definition mode and told you that this mode can be used for the parallel usage of Power Apps as another data entry client for your data1.io application for data collection. Now we want to show you, how this can be executed. Please be aware that (1) this is not a public showcase and (2) Power Apps is not a component of data1.io.
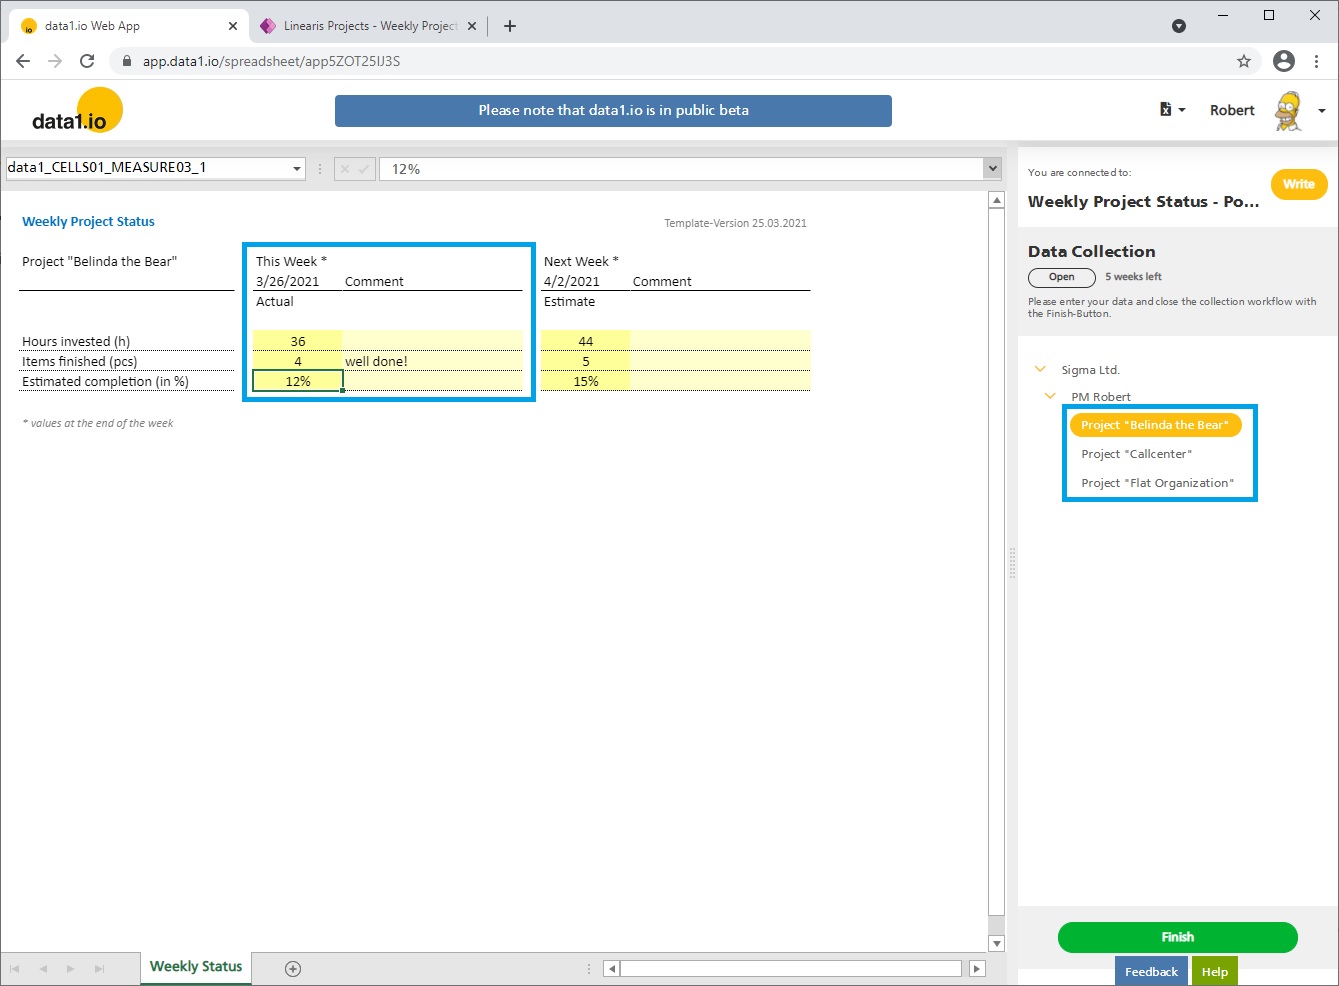
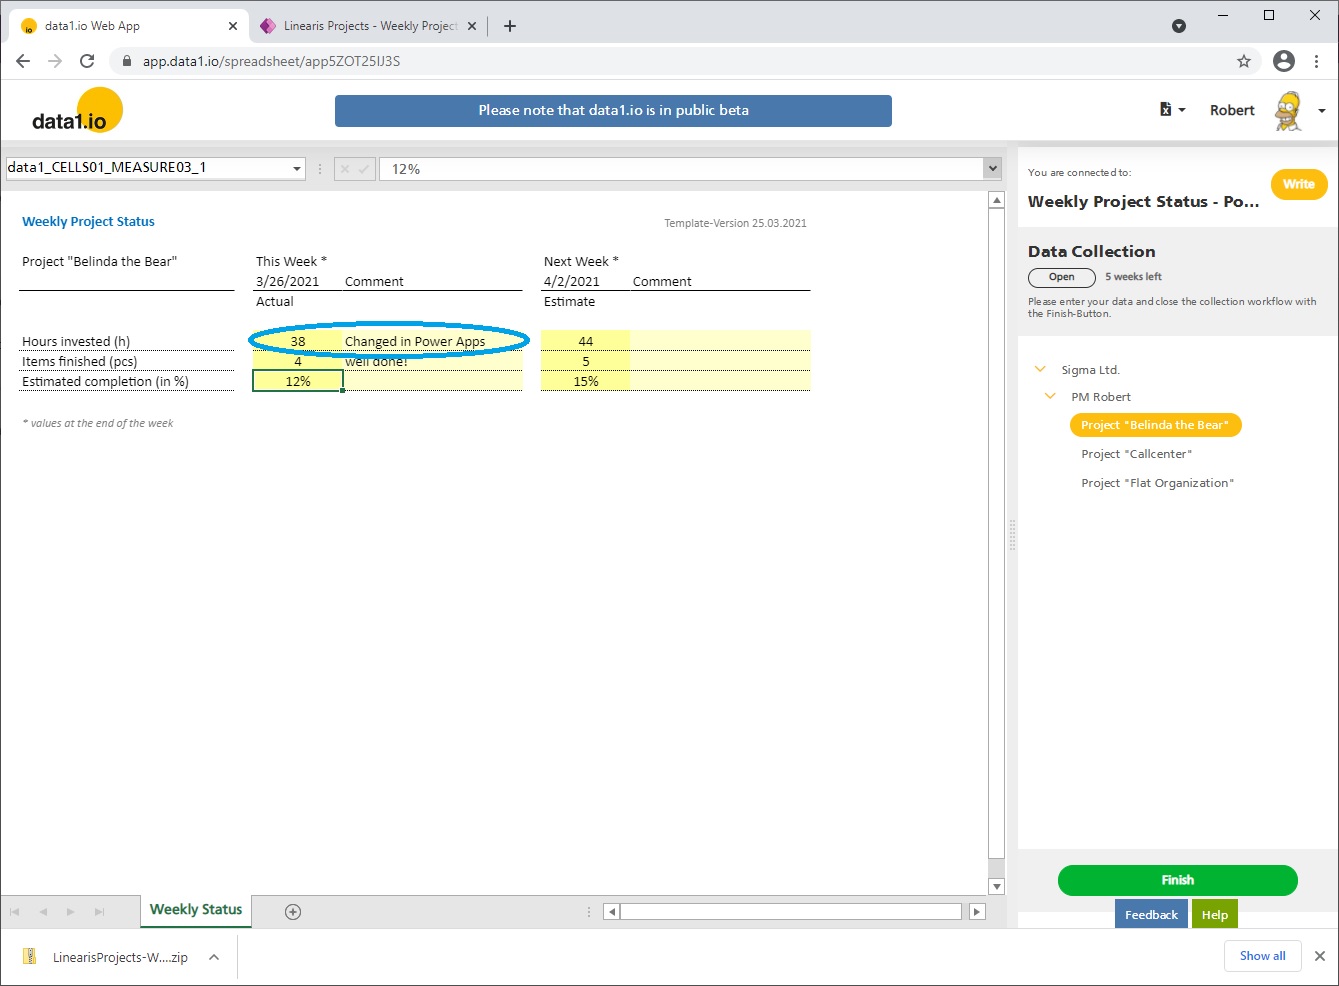
So we have created this data1.io application – it looks like the public showcase Weekly Project Status but we use a workbook in “By Cell” definition mode (read more about that later on) and enter some data:
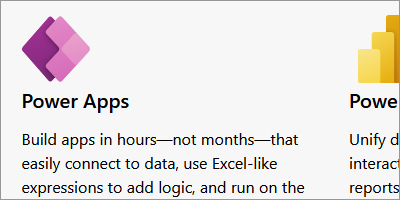
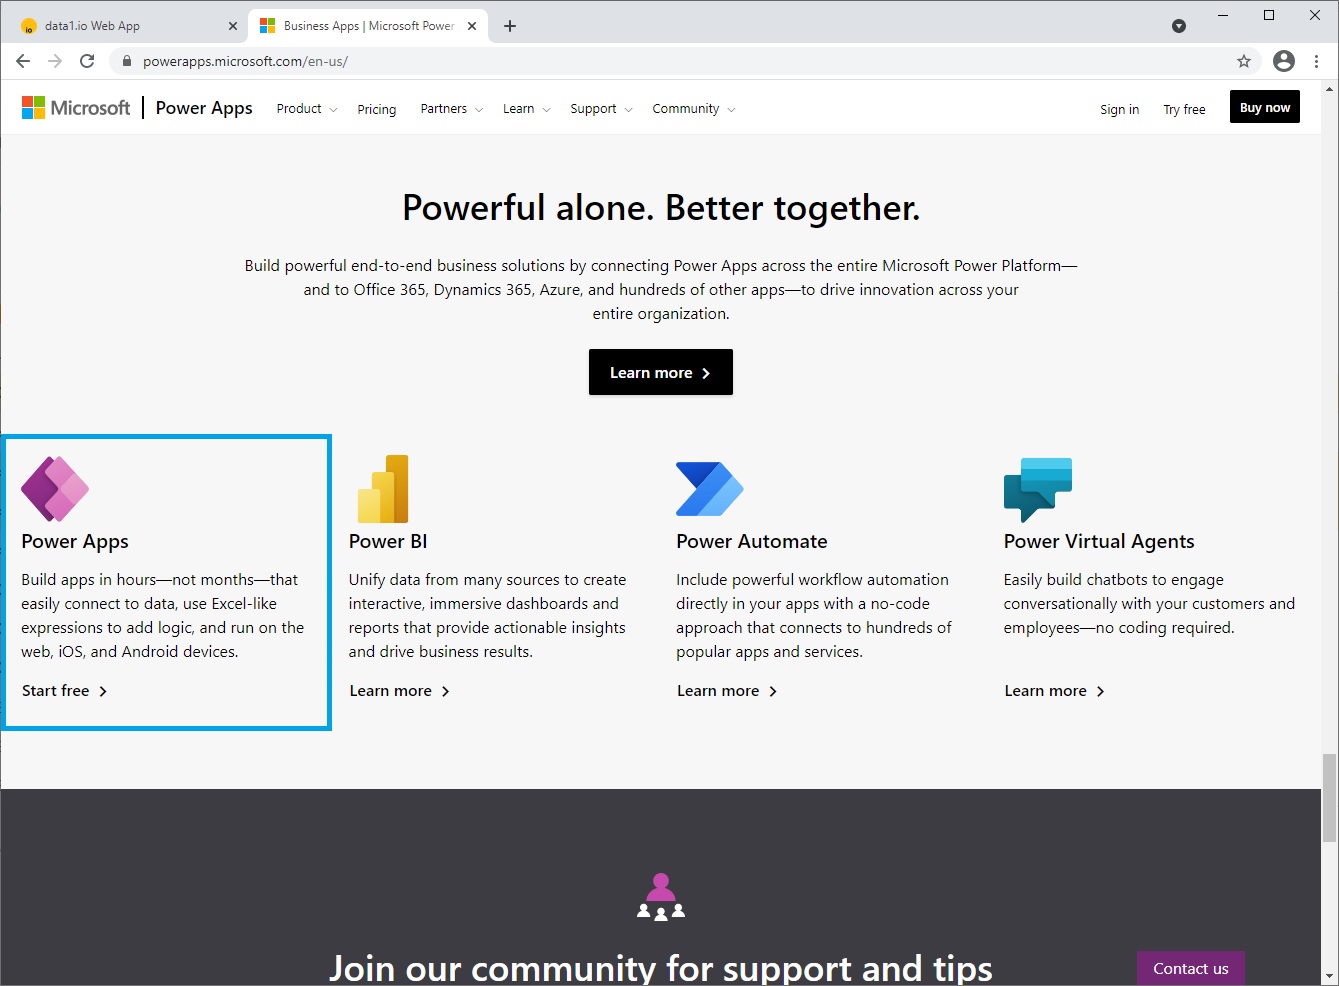
Microsoft Power Apps is part of the so-called Microsoft Platform and can be used pretty well in combination with Power BI, Power Automate and Power Virtual Agents:
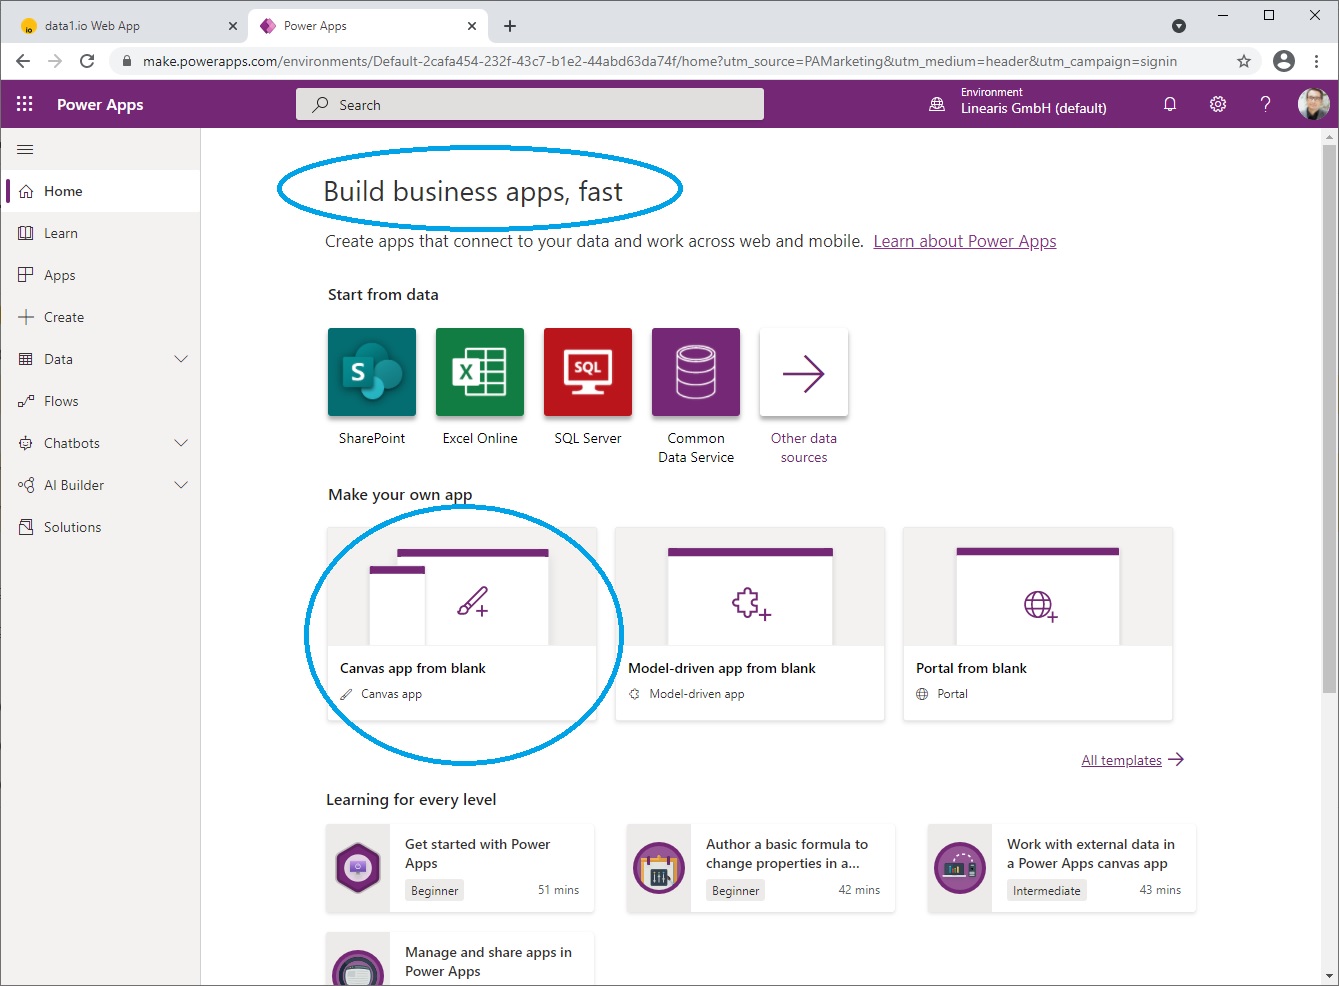
Power Apps is a low code / no code tool from Microsoft to setup mobile data entry forms, we create a so-called “Canvas app”:
Our demo app is really very basic, so it is only a draft for a possible solution. Please be also aware that Power Apps are usually used on tablets and smartphone, for practical reasons we use the Power App here via the browser.
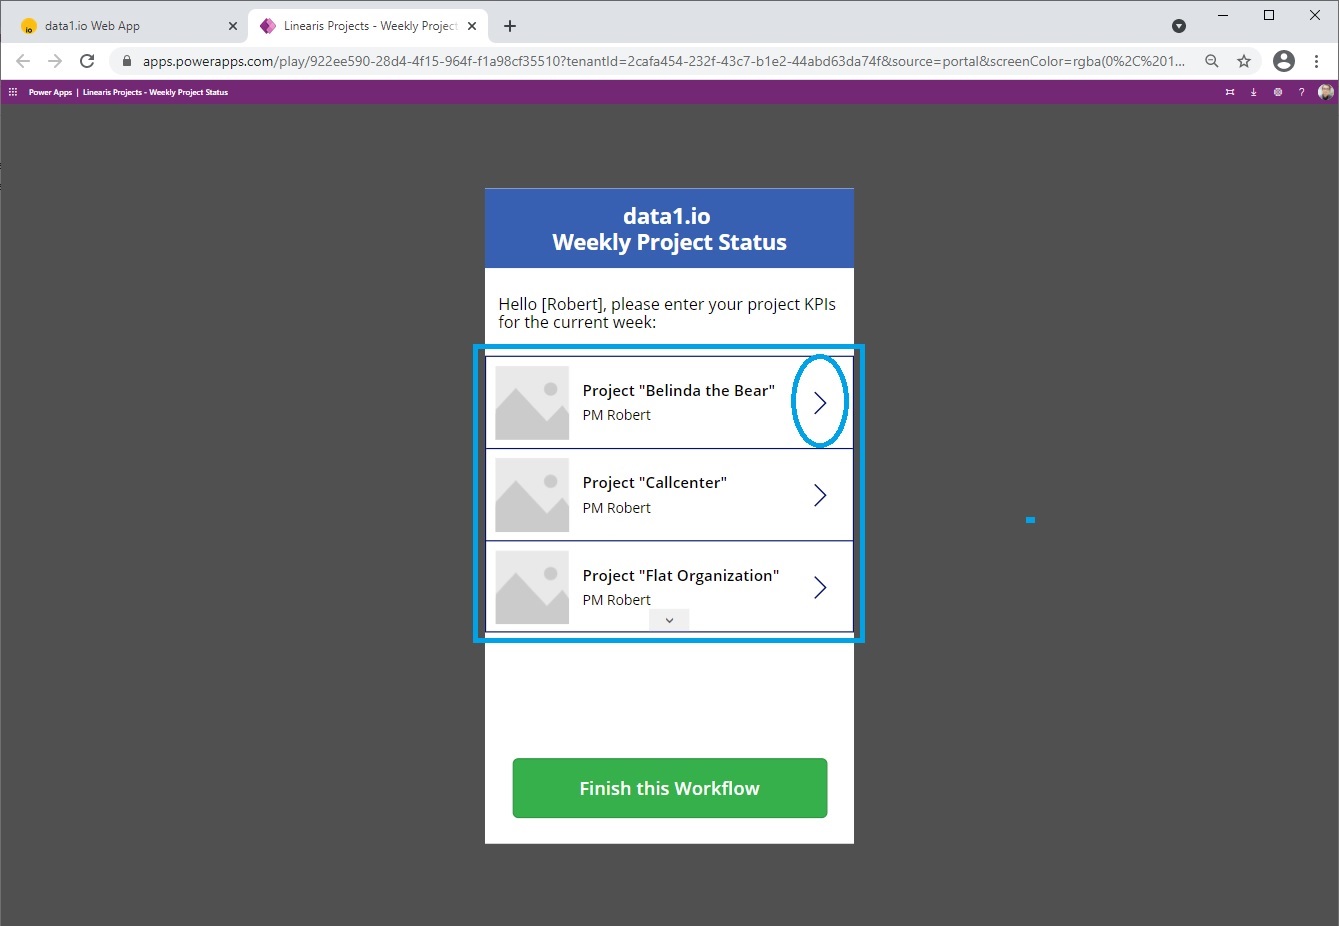
On the first screen you`ll find the so-called Gallery which can be used as a selector for the elements from the data1.io dimension tree:
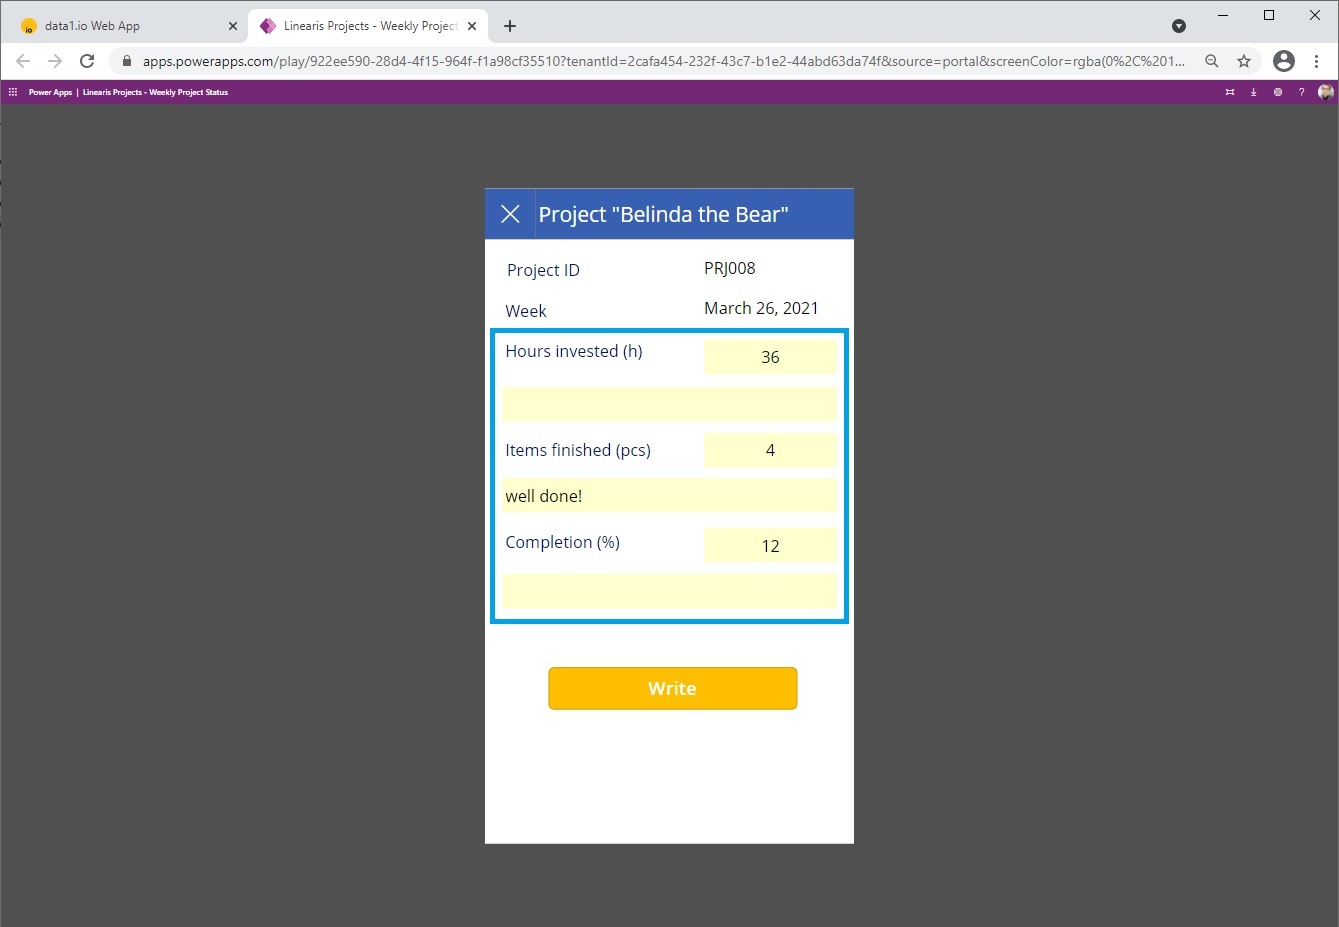
After selecting an element you can see the existing data from the data1.io client …
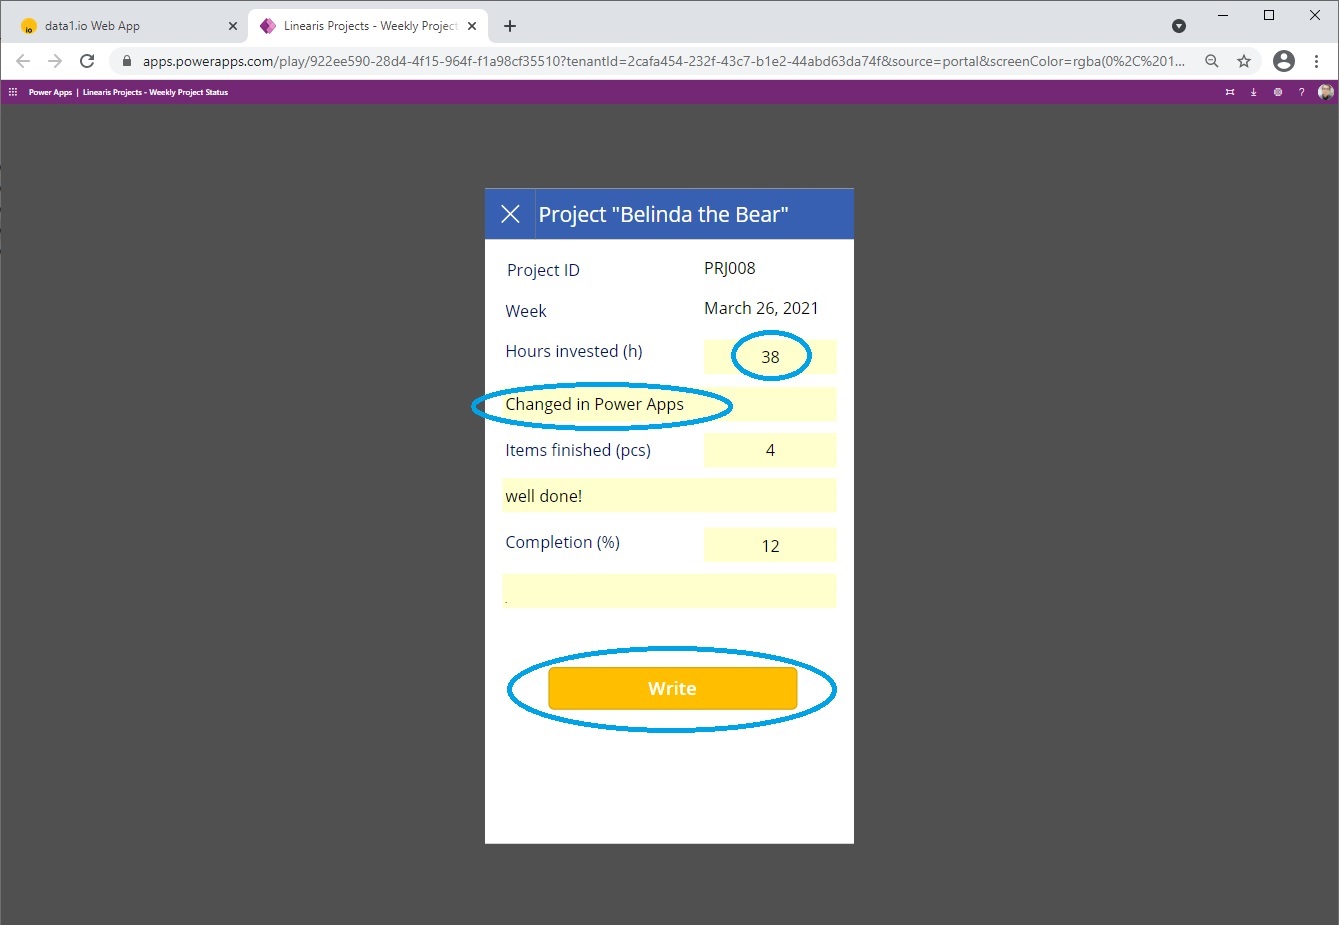
… and of course you can change the data here and write it back to the application:
Switching back to the data1.io Web Client we can refresh the data (by double clicking the dimension tree element) and can see – of course – the updated data from the Power Apps client:
Please be aware that the Power Apps application is NOT part of data1.io system. It is only a demo which can help you setting up your own hybrid data entry scenario.
(2) Web Client: Mode “By Cell”
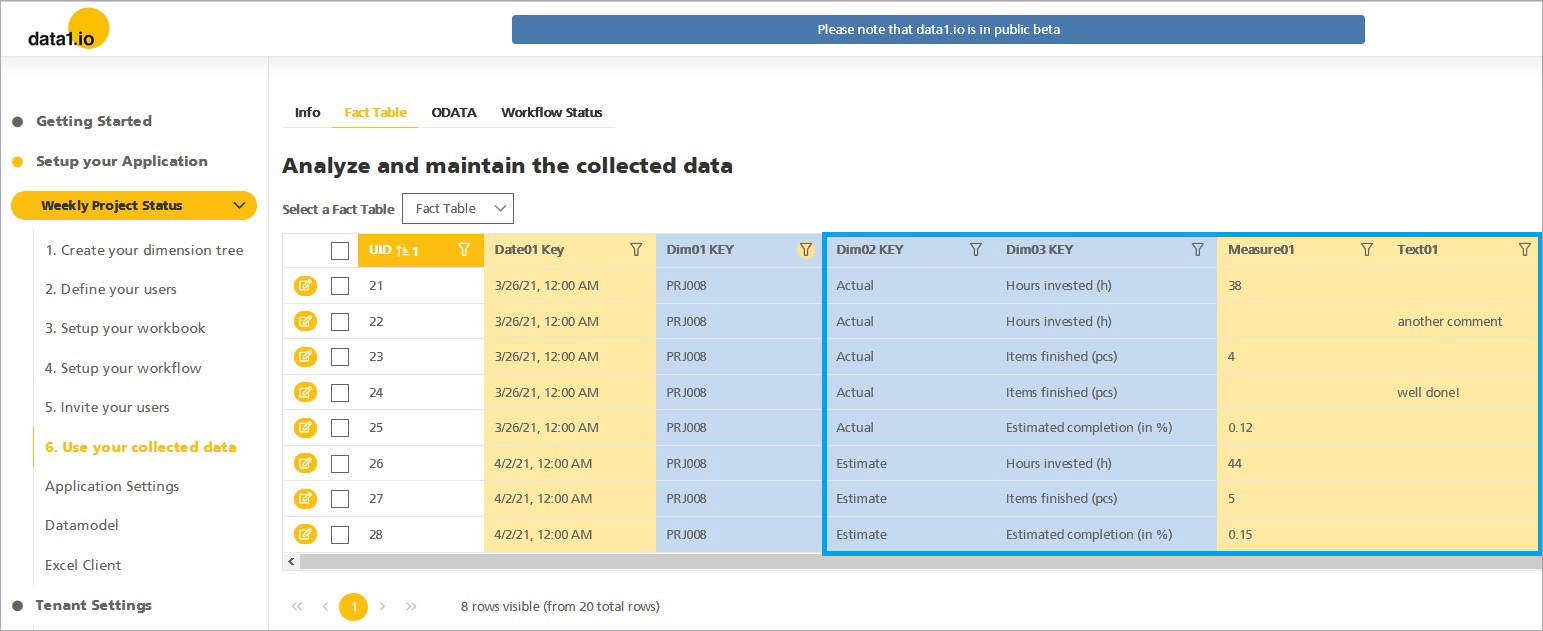
The major backbone of such hybrid data entry scenarios is the recordset granularity in the so-called fact table of the data1.io application. When using the default “By Column” mode in a workbook the data1.io application creates one record for each cell in the workbook. So the data from the above workbook would generate this default recordset structure:
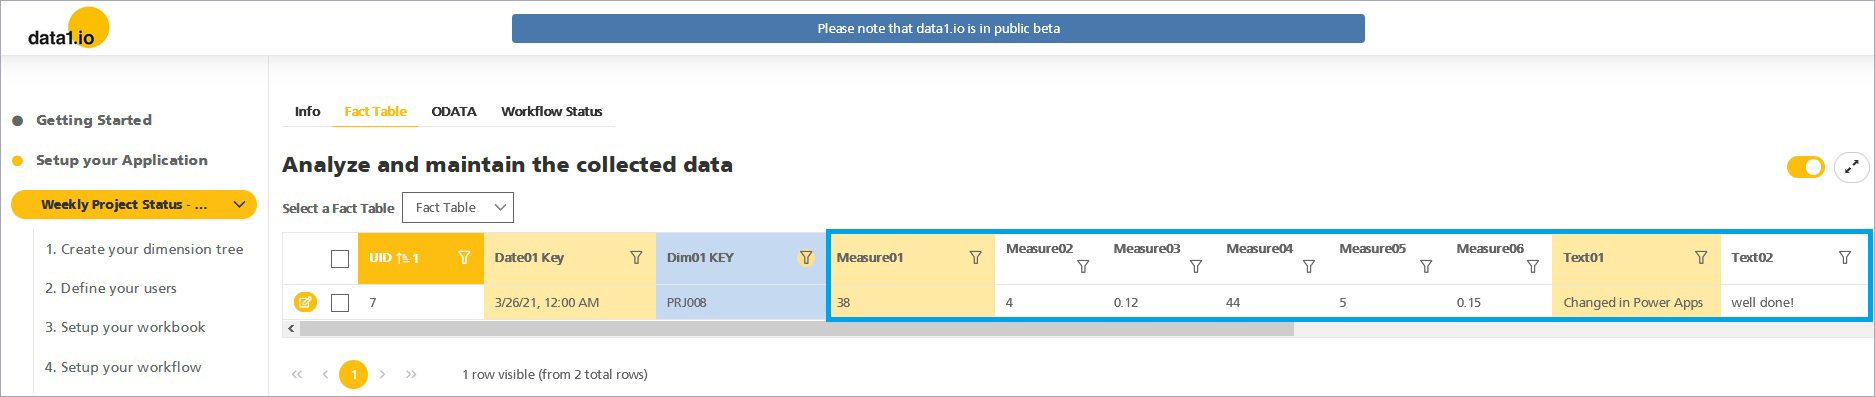
But Power Apps can be used much easier if all the data from the Excel Workbook is stored on one single record like this:
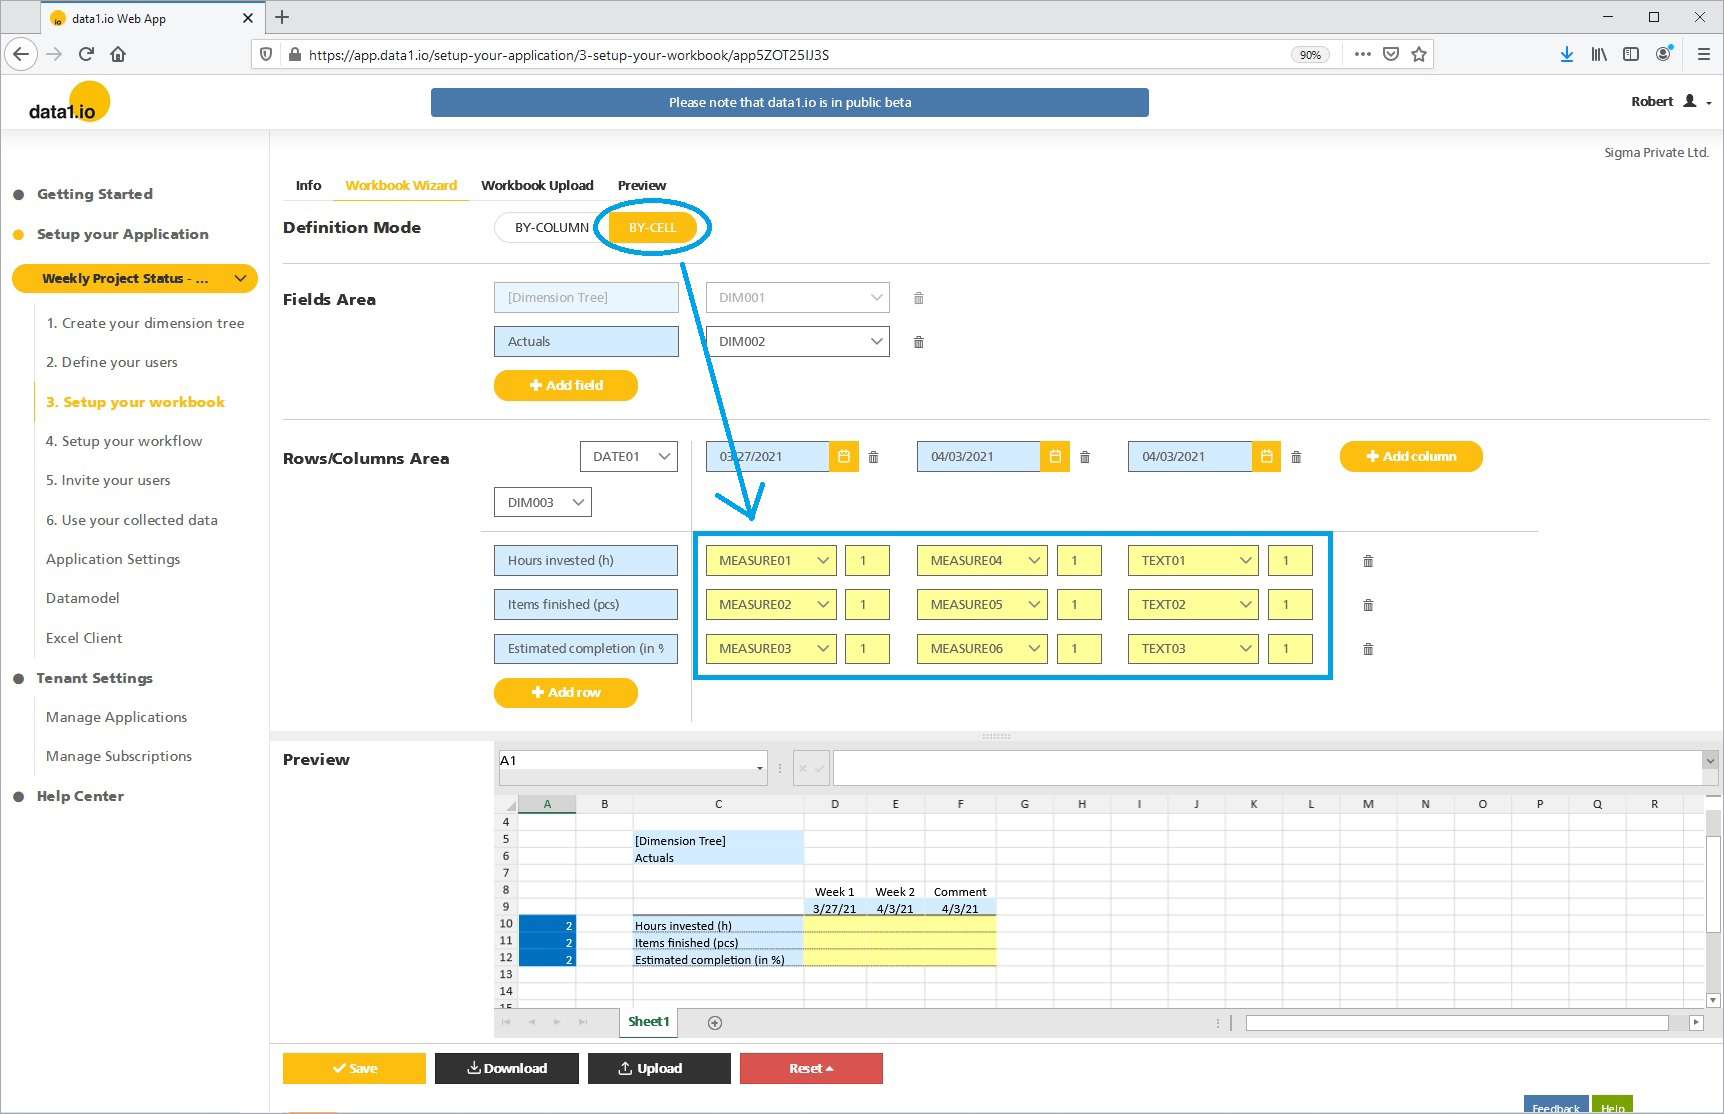
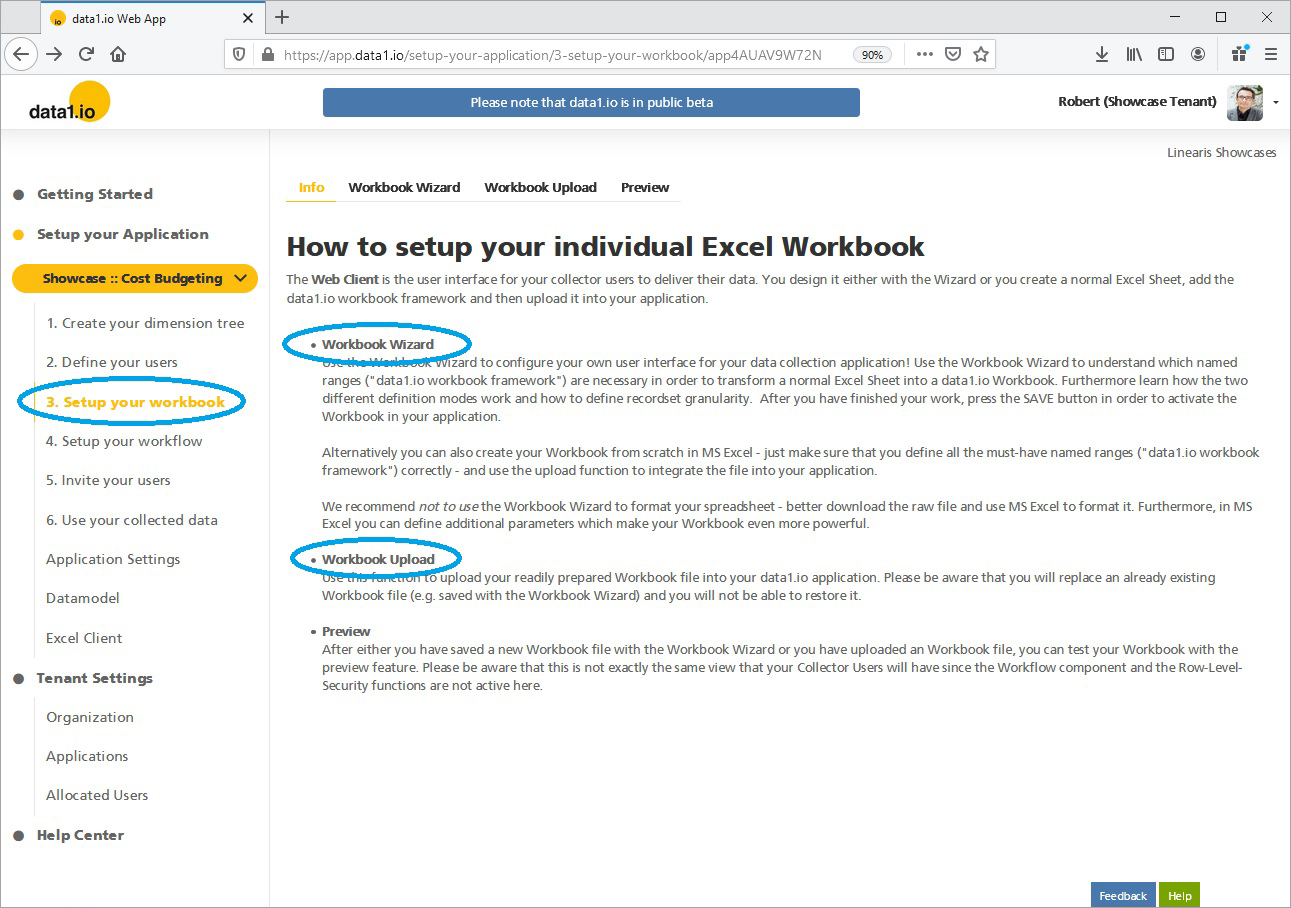
This can be realized by using the so-called “By Cell” mode, we introduced this mode already in the June 2020 release. We recommend to use the Workbook Wizard to understand how it works …
… and then transfer this knowledge to your own Workbook (which is usally set up directly in Excel):
If you need some help in setting up your workbook please feel free to contact us.
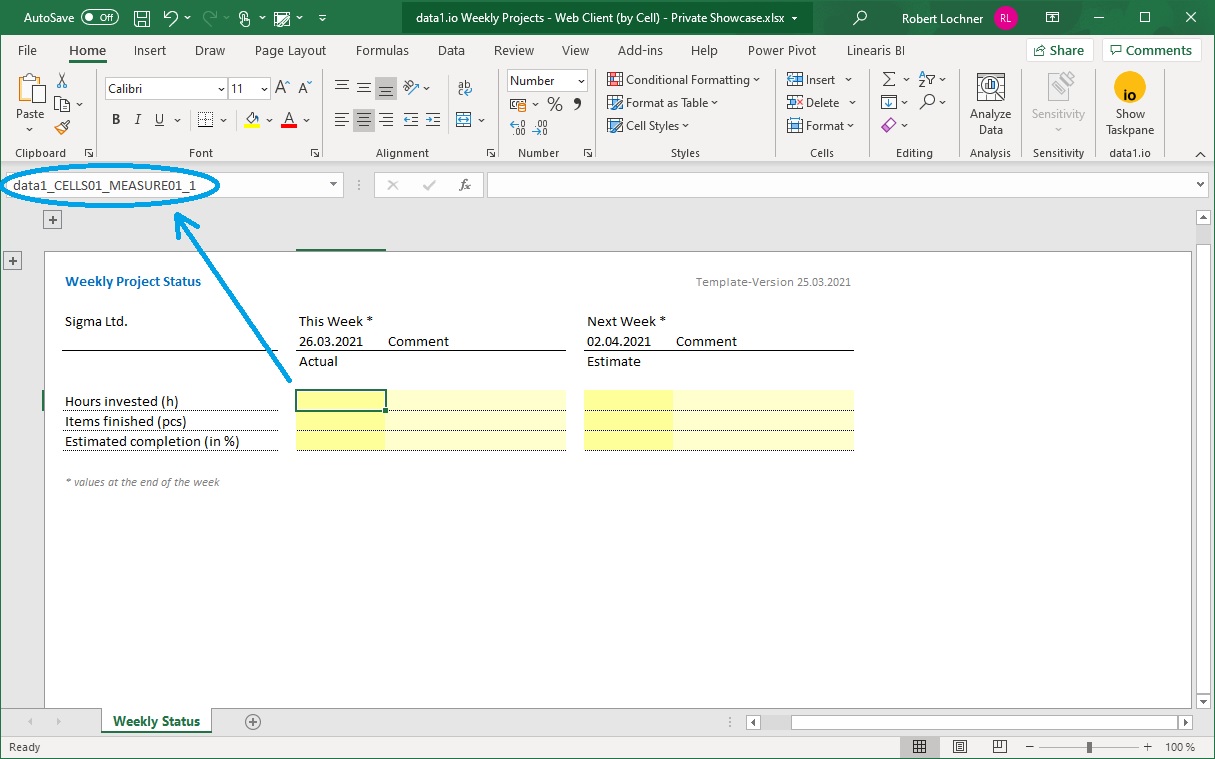
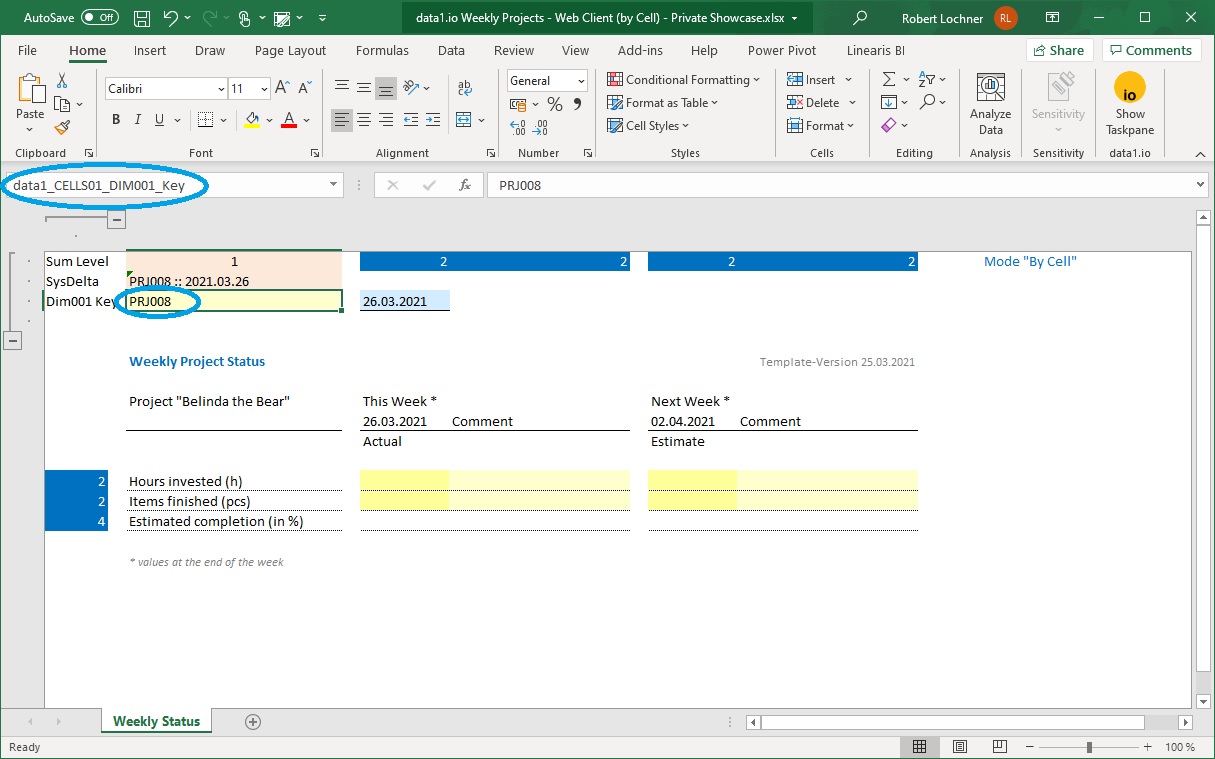
(3) Web Client: New Parameter “data1_CELLS01_DIM001_Key”
There is a new parameter “data1_CELLS01_DIM001_Key” which brings the key of the selected element in the dimension tree into your workbook (additionally to the name of the selected element):
We recommend to use this parameter for the formula in the SysDELTA parameter (to avoid complications due to ambiguous dimension tree element names).
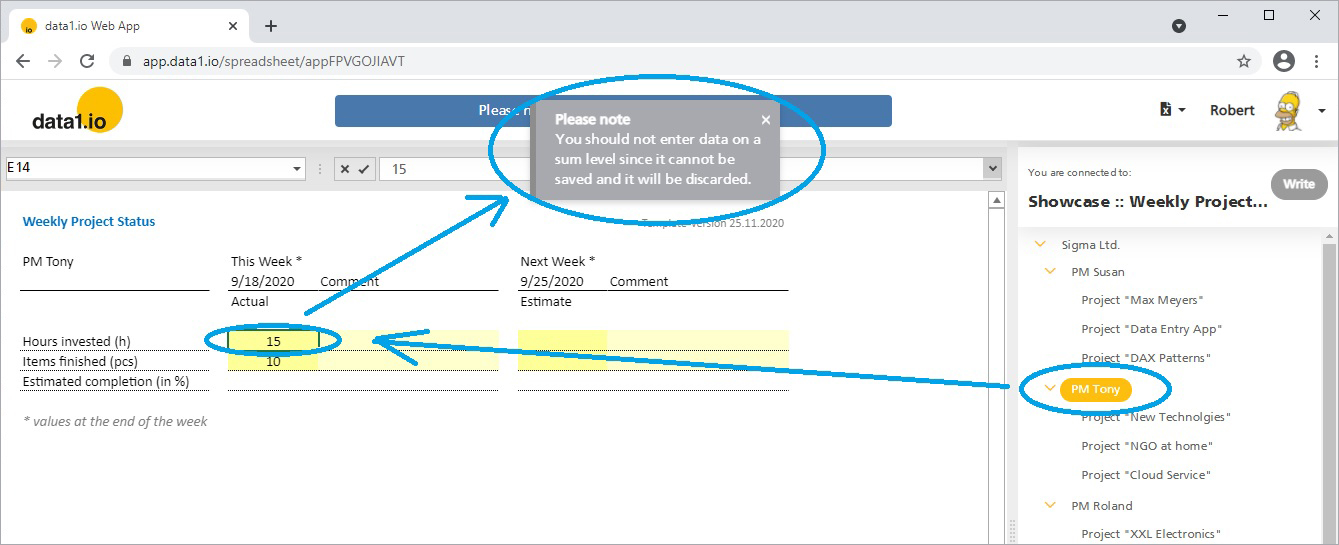
(4) Web Client: Warning when entering data on a sum level
As an end user you`ll get now a warning if you start typing in the workbook if the writback is not active – either because you have selected a sum level element or because the data collection workflow is already closed:
(5) Enterprise Plan: extend your datamodel with additional dimensions
After activating the additional dimension tables that are relevant for your data model …
… you can select the dimension in order to define all dimensions of your datamodel:
You can define the dimension tables manually or – of course – you can upload readily defined dimension tables from Excel:
Please note that at this stage the additional dimensions are primary relevant for external reporting systems like Power BI. In the data1.io system itself you can use the additional dimension for level-specific aggregations.
(6) Enterprise Plan: create and delete applications
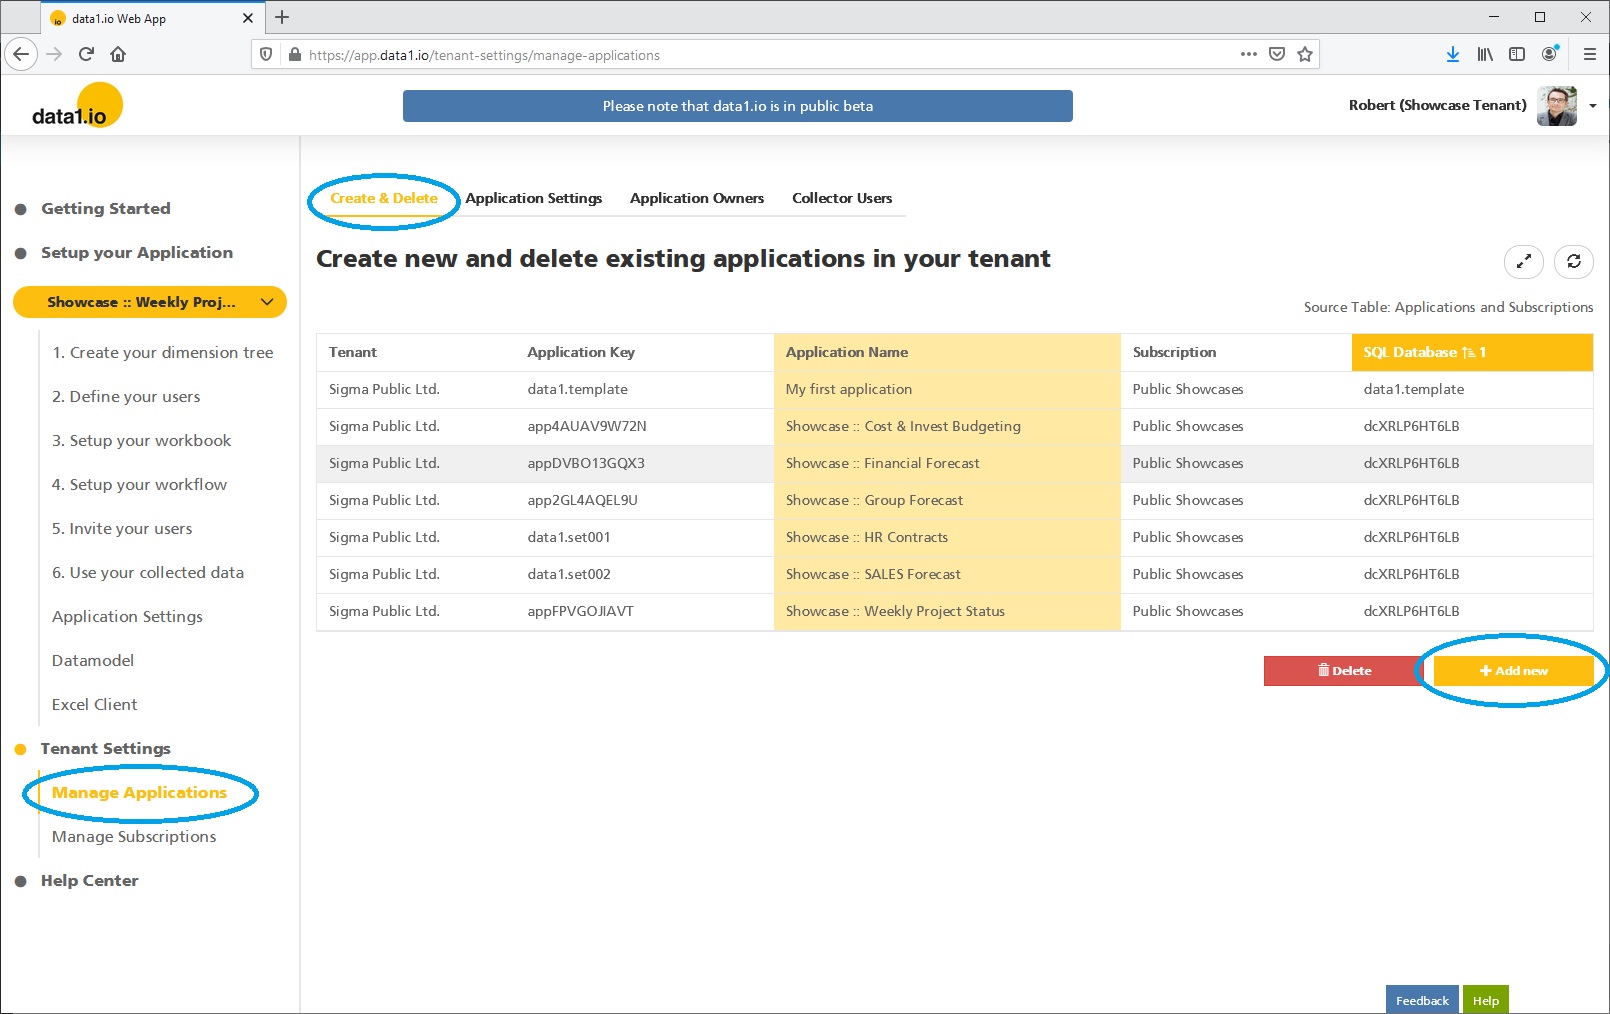
A very important new feature is the possibility to create new applications within your enterprise tenant:
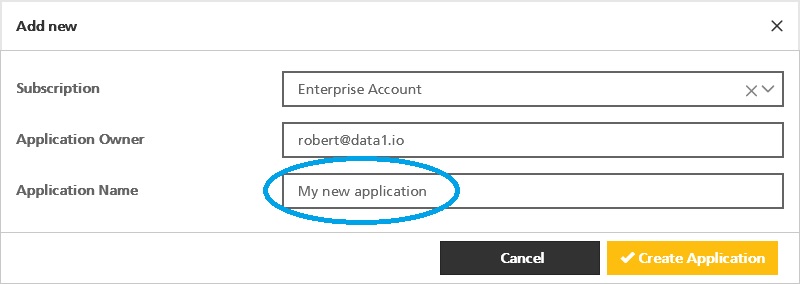
Simply select a valid subscription, define the application owner and set a name for your new application:
It takes about 1 minute until your new application is created and ready to use.
Existing applications now easily can be deleted with the new Delete button. Please be aware that all your data in this application will be deleted – so please download all your collected data from the fact table (and also from the dimension tables) before you delete an application.
(7) Further Improvements: ODATA Feed, User Domains
We have further improved the usage of the ODATA feed – especially the usage of several ODATA feeds from several applications.
Furthermore we have improved the validation of the e-Mail adresses in the user lists: until now domains with more than 3 characters have been rejected. We have improved this with a modern check of valid domains.
(8) Blogpost about the 4th March Live Webinar (in german)
In our first webinar on 4th March 2021 we demonstrated how to collect data with data1.io and how report those data with Power BI by using the ODATA feed. The Webinar was held in german language, so is the blogpost about this webinar:
Hope you like the new features – we are very curious about your feedback! Please let us know what you think and what kind of collection processes you would prefer to automate with data1.io.
And: stay healthy!
https://data-one.cloud/wp-content/uploads/2021/03/Release-March-2021-title.jpg200400Robert Lochnerhttps://data1.io/wp-content/uploads/2021/06/data1.io_Logo_Black-Orange-184-x-300-300x184.pngRobert Lochner2021-03-29 07:26:032021-04-28 23:06:46Release March 2021
We are proud to deliver the brandnew February 2021 release with the new showcase “Cost & Invest Budgeting” and the new parallel dimension tree. Try it now!
Remember, the Web Client is the user friendly spreadsheet for your Collector Users to deliver their monthly/weekly/daily data. The Web App is the tool for the Power User to setup and control your organization’s collection workflows.
(1) New Showcase “Cost & Invest Budgeting” (in German)
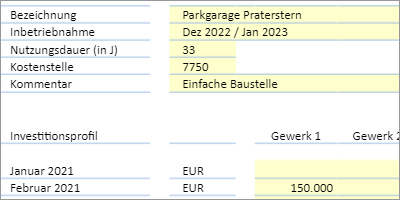
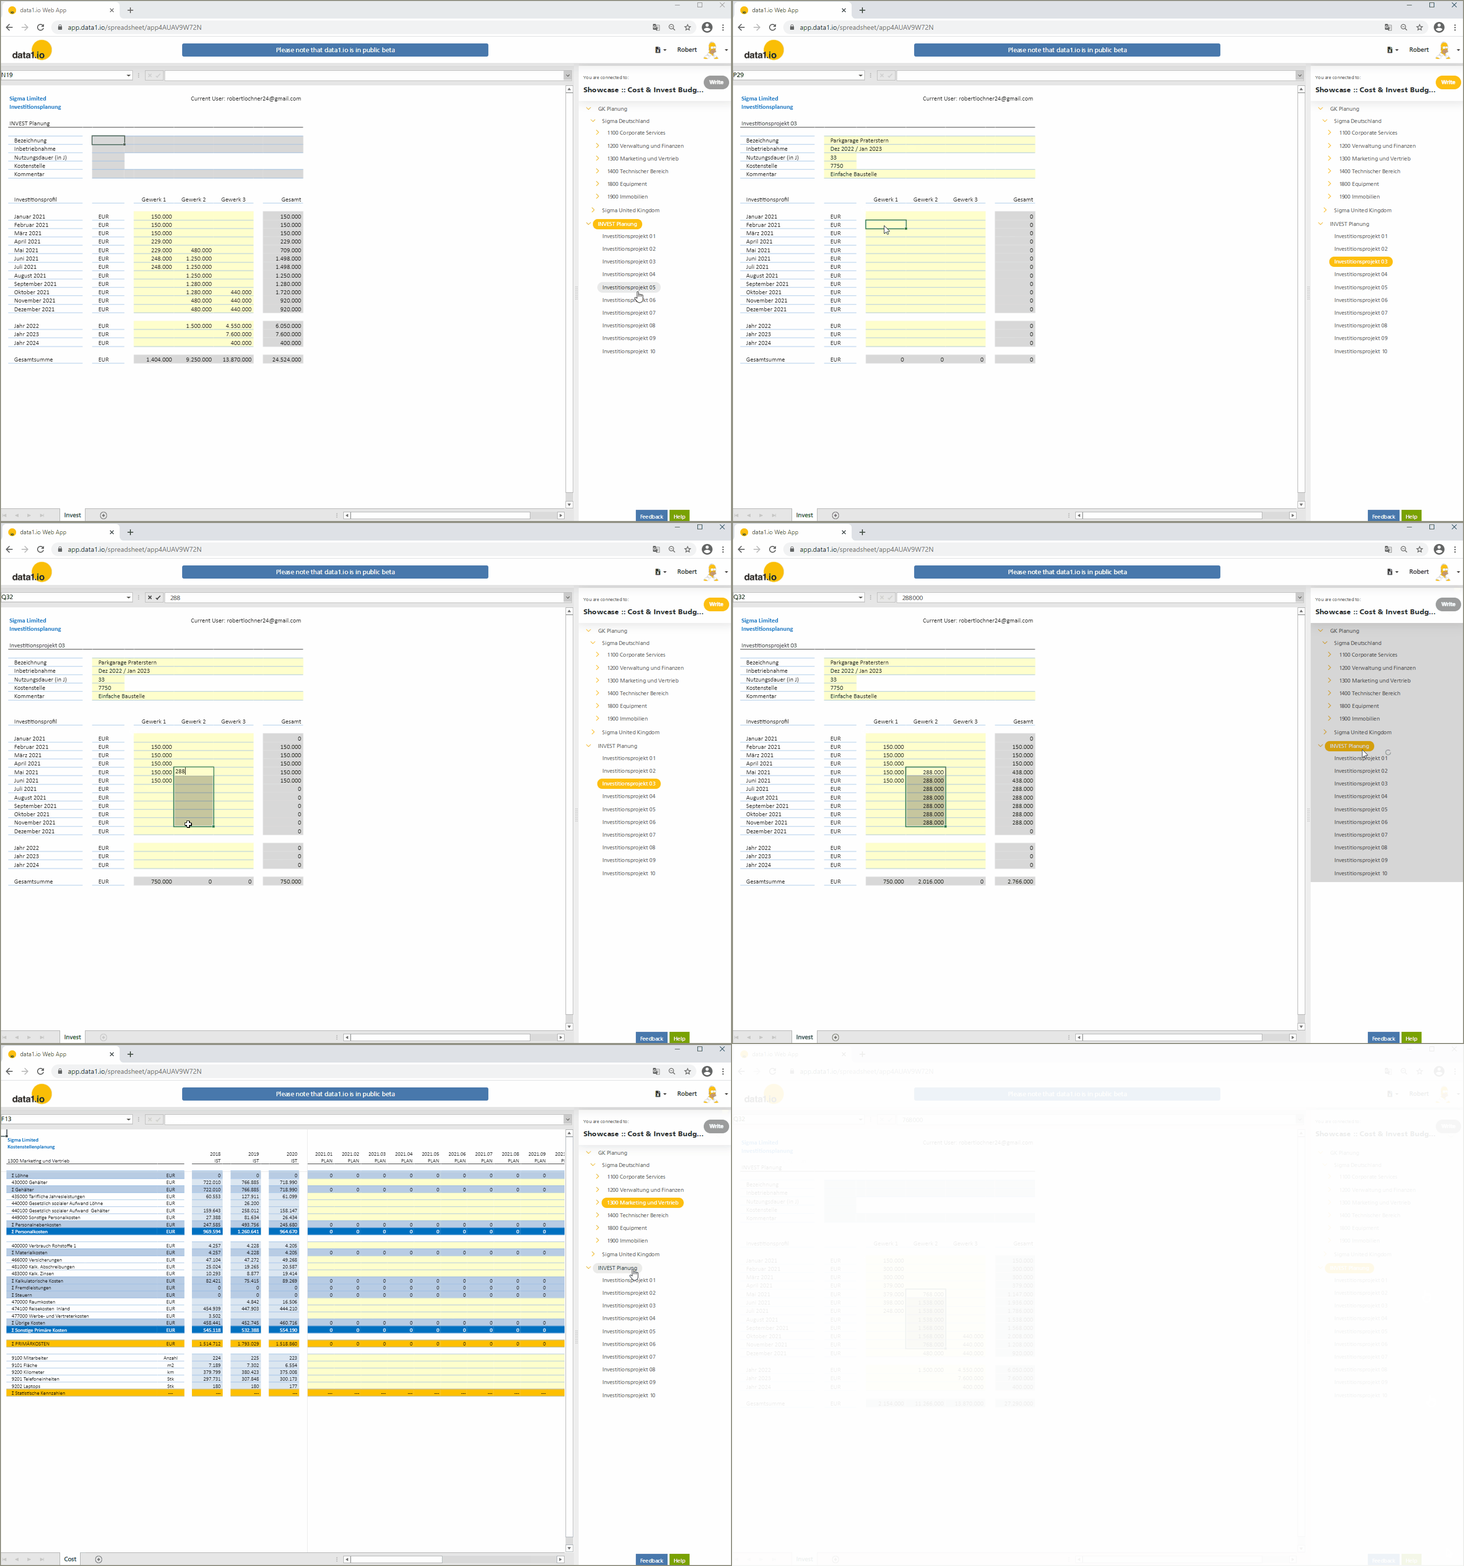
We have added a new “Invest Planning” module to our last month released showcase “Cost Budgeting”. This new showcase has got now two more very interesting features:
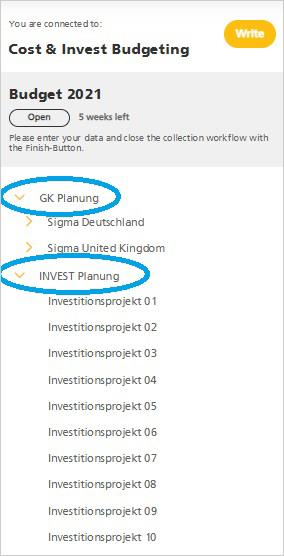
The dimension tree has two parallel branches, one for the cost planning and another one for the invest planning
Depending on the element selected (from the dimension tree) the data entry sheet changes dynamically
You`ll find in the next two items more about these special new features. Again, we want to thank one of our highly motivated early adopter users who had again really good ideas for this usecase and showed us that it was quite easy to realize this. 🙂
(2) New Parallel Dimension Tree
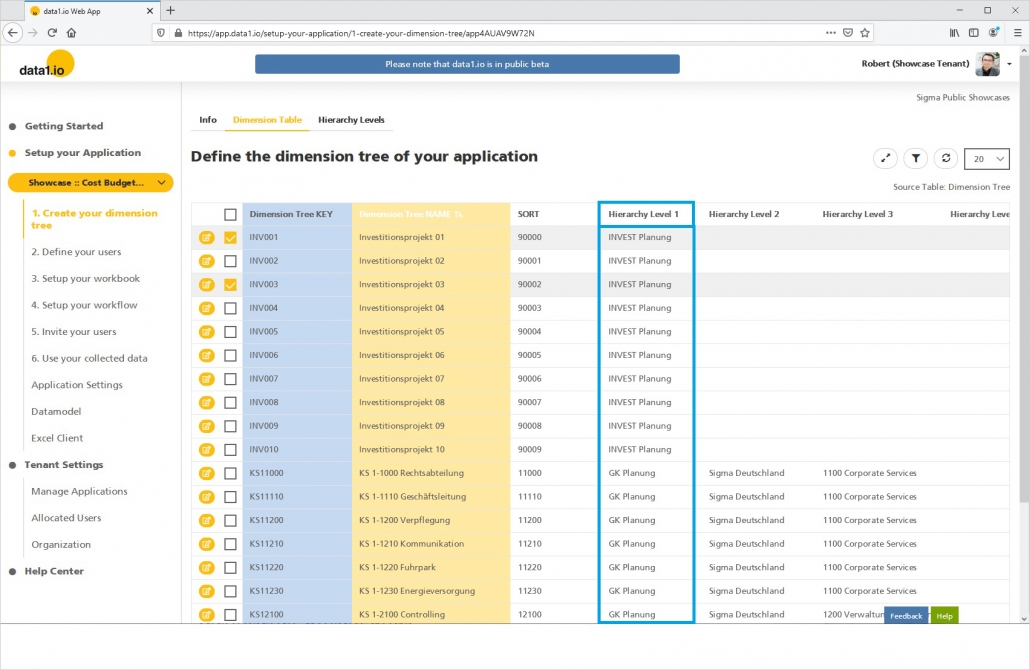
It is now possible to define parallel branches within the dimension tree in order to realize scenarios like the “Cost & Invest Planning” showcase:
It`s quite easy to define – simply use different element names in the top level field of the dimension tree definition table:
(3) Web Client: New “data1_CurrentSheetVisible” Parameter
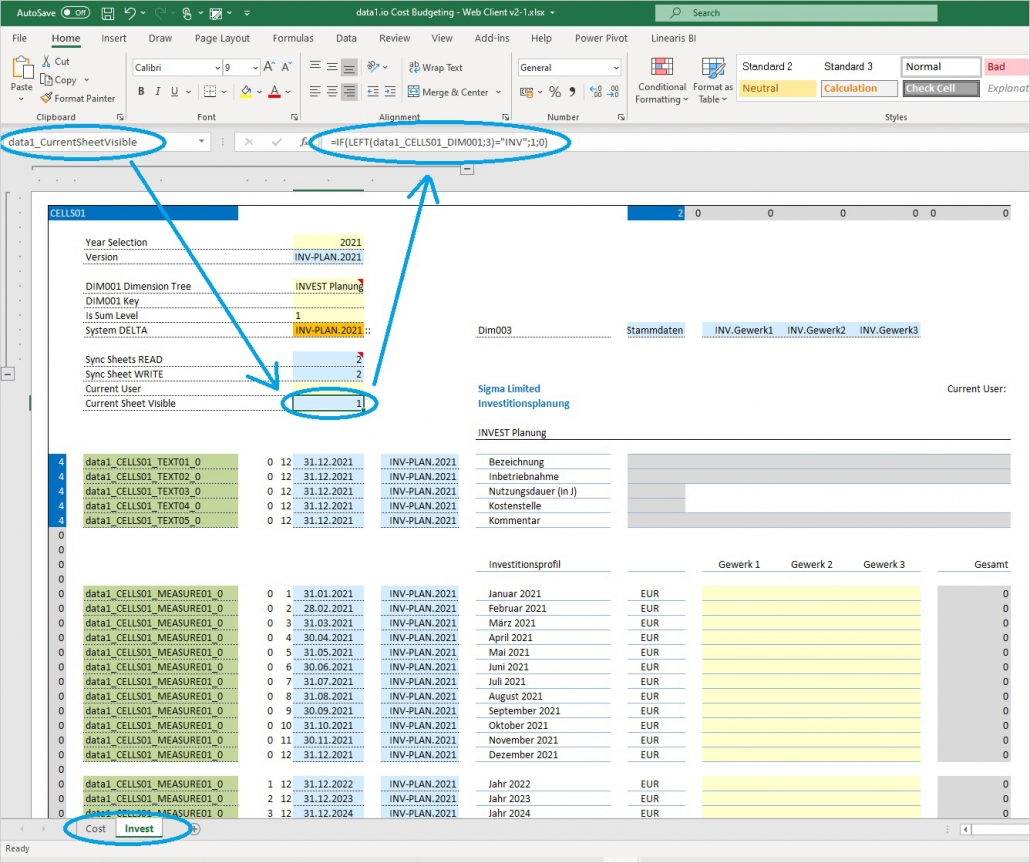
How is the “automatic sheet change” realized?
Basically it`s very simple: just define a cell with the named range name “data1_CurrentSheetVisible” and write either 0 or 1 in this cell:
0 = invisible
1 = visible
Then replace the value by a formula to control the visibility of the right sheet(s). From our point of view there are at least two major fields of applications for this parameter:
Element (type) based visibility = depending on the selected element (type) more or less sheets are visible
User based visibility = depending on the logged in user more or less sheets are visible
Please be aware that in many cases it will be necessary to refresh all sheets at once with the Sync Sheets READ parameter in order to deliver a smooth change between the sheets.
(4) Web Client: New “data1_CurrentUserKey” Parameter
Another new (optional) parameter is the Current User parameter. Define a named range called “data1_CurrentUserKey” and you will get delivered the name of the current user into your workbook. Use it just to display it in your workbook …
… or use it to implement user-specific calculations, sheet visibility rules (“Object level security”) and many more.
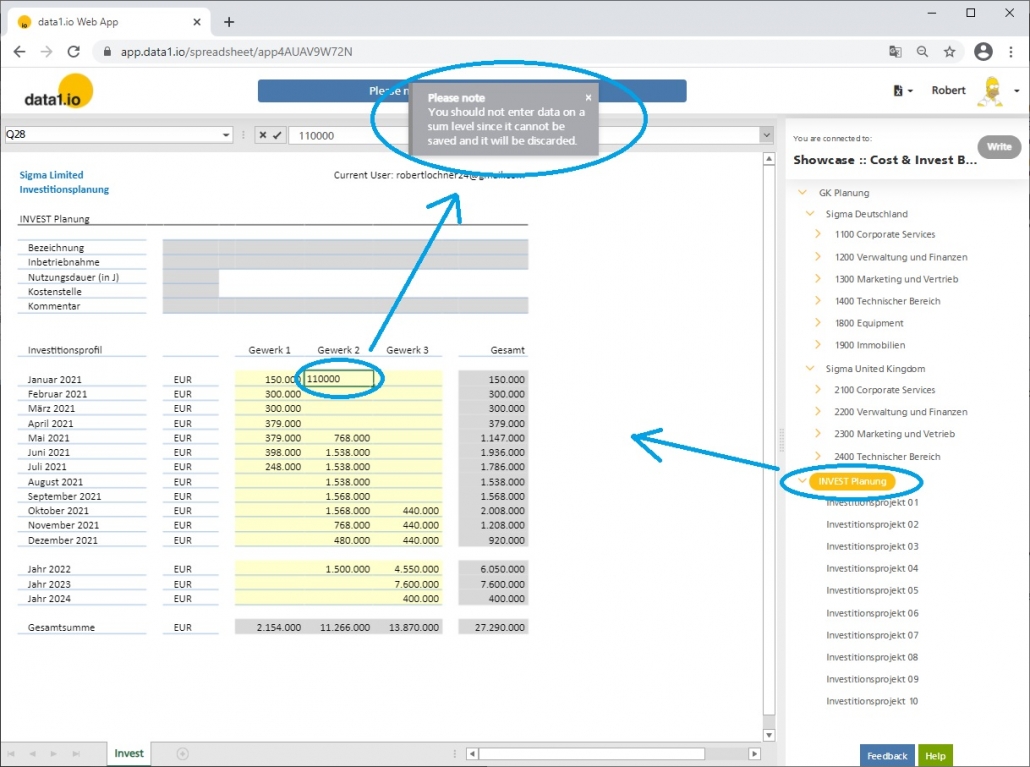
(5) Web Client: New Warning on Sum Level
Since it is not possible to writeback data on a sum level you will get a warning if you type in data into your workbook when a sum level node is selected in the dimension tree:
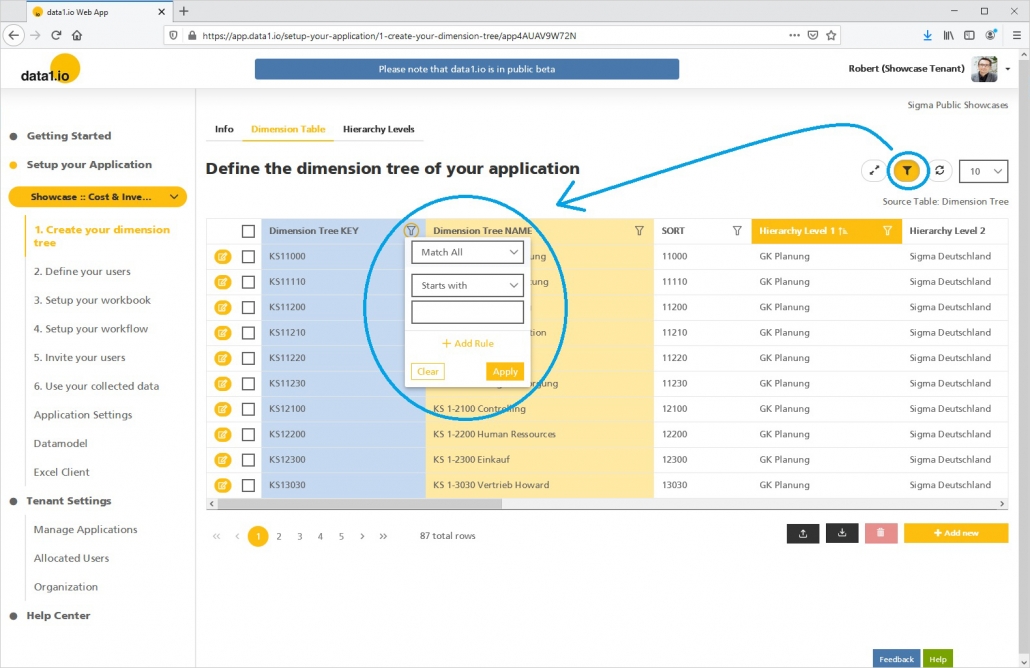
(6) Web App: New Table Filter
We have replaced our old table filter in the Web App which was a little confusing and not very powerful. You`ll find the new table filter when you activate the filter in any table in the Web App:
(7) New Capacity Pricing Tiers
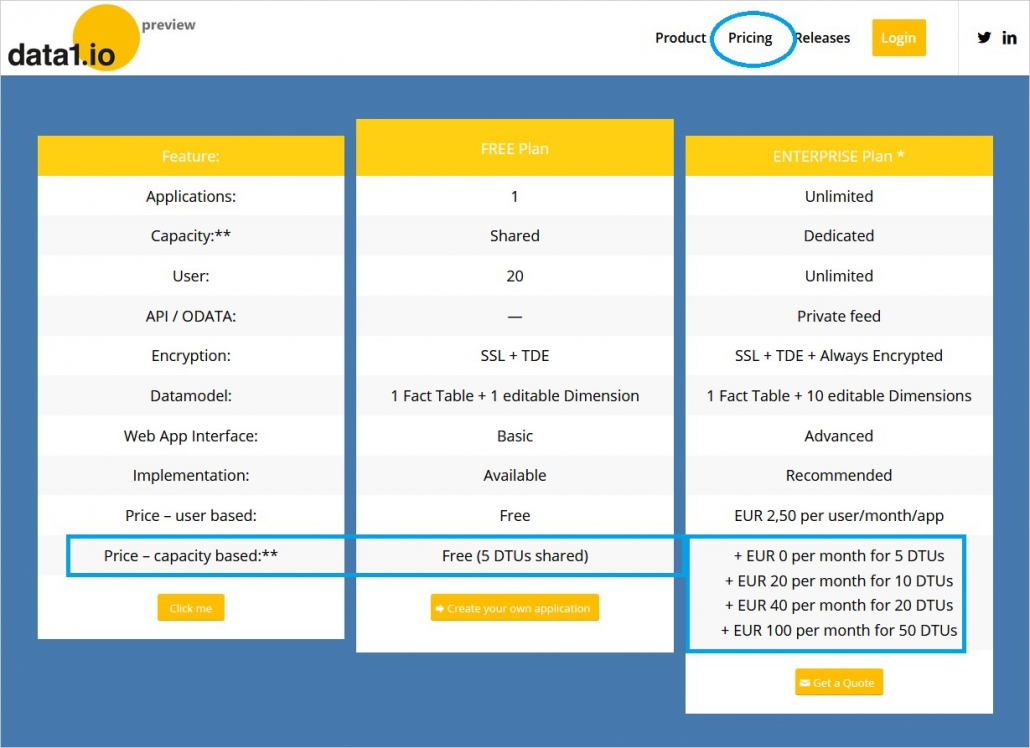
We are happy that we can offer now capacity based pricing tiers and therefore deliver a “performance boost” for applications which need computing power. Furthermore we make transparent that our default databases – both shared or dedicated – run with a 5 DTU SQL Azure Database.
It is very important to emphasize that with every change in our pricing tiers all our existing users – both free and enterprise – keep their conditions for lifetime. So your conditions only can get better and never get worse.
Hope you like the new features – we are very curious about your feedback! Please let us know what you think and what kind of collection processes you would prefer to automate with data1.io.
And: stay healthy!
https://data-one.cloud/wp-content/uploads/2021/02/Release-February-2021-Title.jpg200400Robert Lochnerhttps://data1.io/wp-content/uploads/2021/06/data1.io_Logo_Black-Orange-184-x-300-300x184.pngRobert Lochner2021-02-23 17:01:152021-05-31 08:25:16Release February 2021
New year, new features! We are glad to deliver the brandnew January 2021 release with the new showcase “Cost Budgeting” and the new security feature “Always Encrypted“. Try it now!
Remember, the Web Client is the user friendly spreadsheet for your Collector Users to deliver their monthly/weekly/daily data. The Web App is the tool for the Power User to setup and control your organization’s collection workflows.
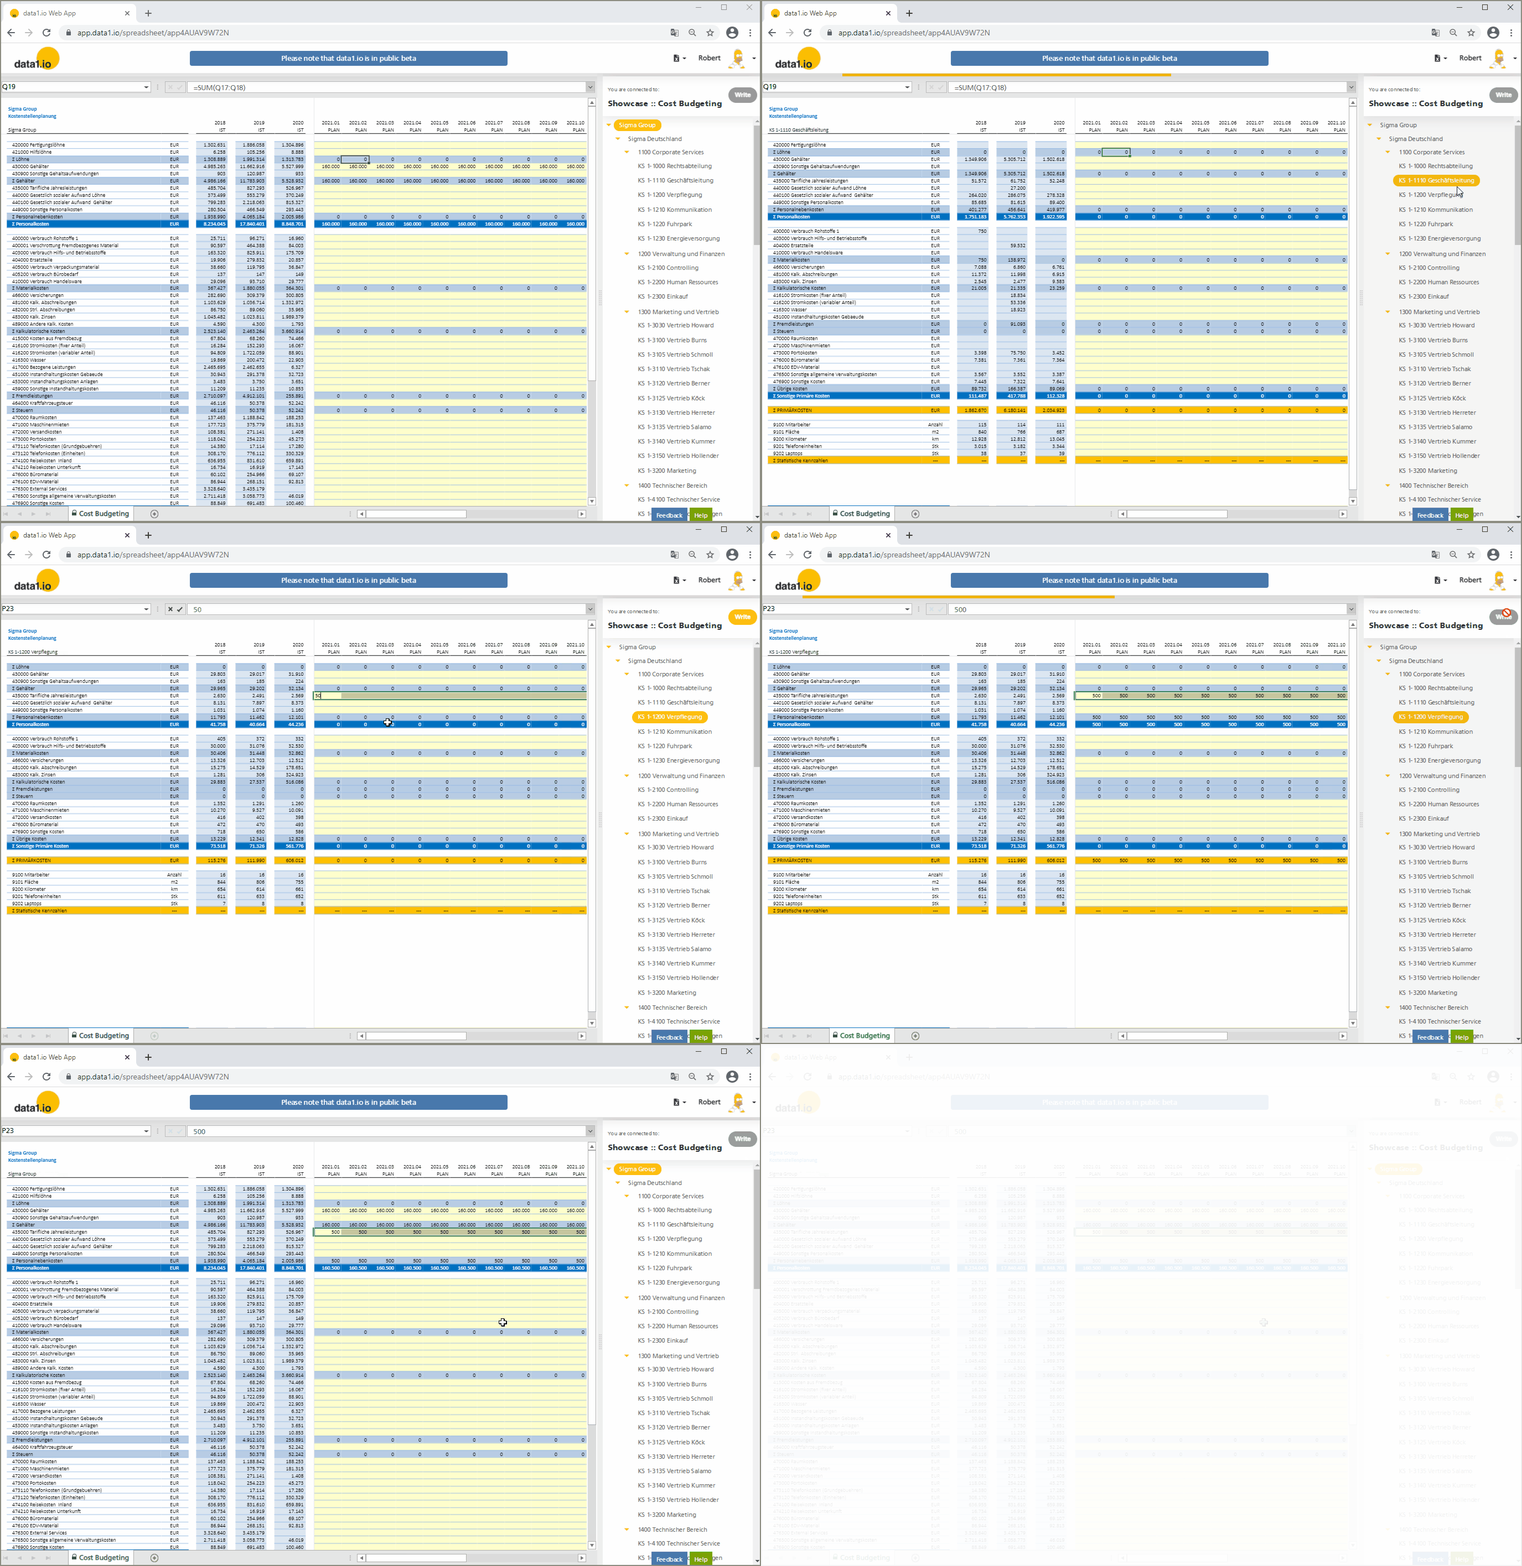
(1) New Showcase “Cost Budgeting”
You`ll find the new showcase in our showcase gallery (immediately after login):
From a technical point of view this showcase is interesting because:
Dynamic rows = after switching to a dimension tree element only those rows are visible that have actuals
Yearly Aggregation of Actuals (from about 30.000 imported actual records)
You`ll find in the next two items more about these special new features. We want to thank one of our highly motivated early adopter users who had all the really good ideas for this usecase and showed us that only a few developments were necessary to realize this. 🙂
(2) Web Client: Dynamic rows (“reapply filters”)
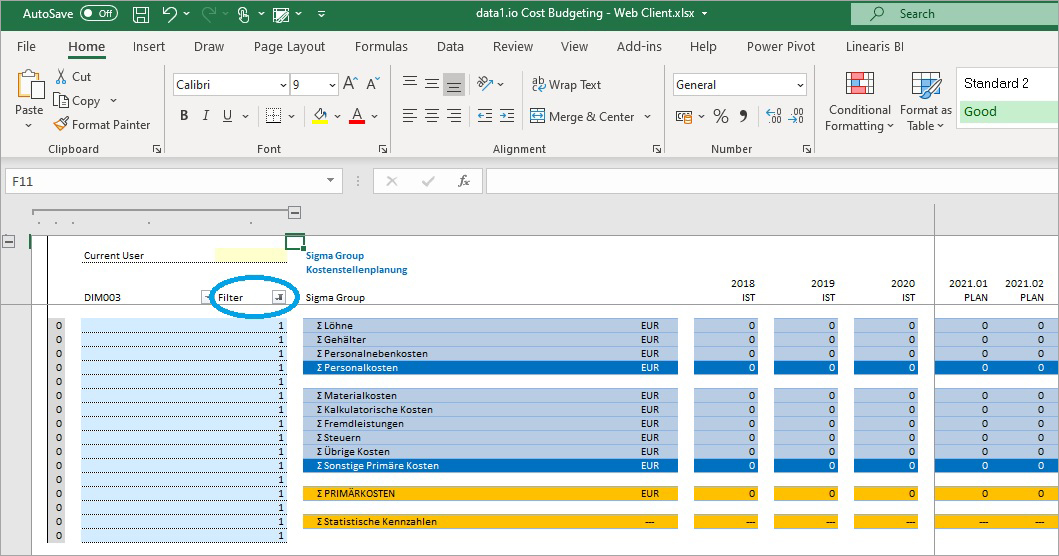
The dynamic rows feature is implemented as a (simple) filter in the background …
… using a control column which generates a row type: type “0” says the row is a data entry and has no acutal – and this type is set to be filtered out:
In the Web Client we have implemented the “reapply filters” function which is executed automatically if the workbook contains an active filter (there is no need to define a control parameter).
(3) Web Client: Levels by column or by row
We introduced the date aggregation parameter “data1_CELLS01_DATE01_Level” in the December 2020 Release as a single cell parameter (“one for all”). With this release you can use this parameter as a “bar” for column- or row-specific definitions:
This way the actuals can be retrieved on a yearly level and budget data can be saved on a monthly (= date) level.
(4) Web Client: READ performance boosted again
When developing our new costcenter showcase we saw that the READ performance on the top level of the dimension tree was pretty poor:
Therefore we created indizes in the SQL Database and switched the MS Azure plan for our showcase databse to the more expensive 10 DTU plan – this improved READ performance from 19,5 sec to 6,0 sec! As a consequence, we will offer in the near future all our customers with an Enterprise Plan to switch (optionally of course) to a more powerful SQL database (and paying the difference to the default SQL database).
(5) Database: New Security feature “Always Encrypted” (Enterprise Plan only)
Finally we managed to realize a promise to all Enterprise Plan customers: the Always Encrypted feature. Always encrypted is a security technology from Microsoft SQL Server which makes columns with crucial content (like credit card numbers) on a table level unreadable (as long as you do not have the key the decrypt it). We decided to encrypt as a first step only the Measures columns since this seems to have only little performance implications and gives a high protection. Encrypting every column in every table of the datamodel would kill performance, so it will be important to find the right compromise between security and performance:
Of course, Always Encrypted has only on a database level a visible effect. Within the data1.io application you as an Application Owner (or Tenant Admin) can of course see the figures in clear letters. Of course, we adopted also the import and the export functions to work with this new column feature.
Furthermore, if you access your database with an external tool – here we use our own tool TABLE.Manager – then the encrypted columns aren`t even visible (our tool recognizes at least that 1 column is missing):
We will test this new Always Encrypted feature with our showcase
(6) Web App: Renaming “Templates” to “Workbooks”
We decided to replace the term “Template” or “Excel Template” by the new term “Workbook” or “Excel Workbook”:
The reason is simply that “Template” was often misunderstood. Probably it will take several months to remove the old term from all pages and documents. 🙂
(7) Further Improvements
We solved some problems with larger amounts of records in the fact table (> 60.000). There were issues both when uploading a larger amount of records to the fact table as well as deleting a larger amount of records from it. Furthermore we optimized the timeout settings for (SQL) queries.
Hope you like the new features – we are very curious about your feedback! Please let us know what you think and what kind of collection processes you would prefer to automate with data1.io.
And: stay healthy!
https://data-one.cloud/wp-content/uploads/2021/02/Release-January-2021-Title.jpg200400Robert Lochnerhttps://data1.io/wp-content/uploads/2021/06/data1.io_Logo_Black-Orange-184-x-300-300x184.pngRobert Lochner2021-01-29 14:57:552021-04-28 23:08:54Release January 2021
We are happy to deliver the brandnew December 2020 release with pretty cool new reporting features. Try it now!
Remember, the Web Client is the user friendly spreadsheet for your Collector Users to deliver their monthly/weekly/daily data. The Web App is the tool for the Power User to setup and control your organization’s collection workflows.
(1) Web Client: READ Performance increased by another 100%!
We are happy that we could increase the performance of the READ process by another 100% – after the same increase already in the October Release. The effect can be observed best in our most intensive public showcase – the Financial Forecast:
(2) Web Client: Aggregation queries on dimension attributes
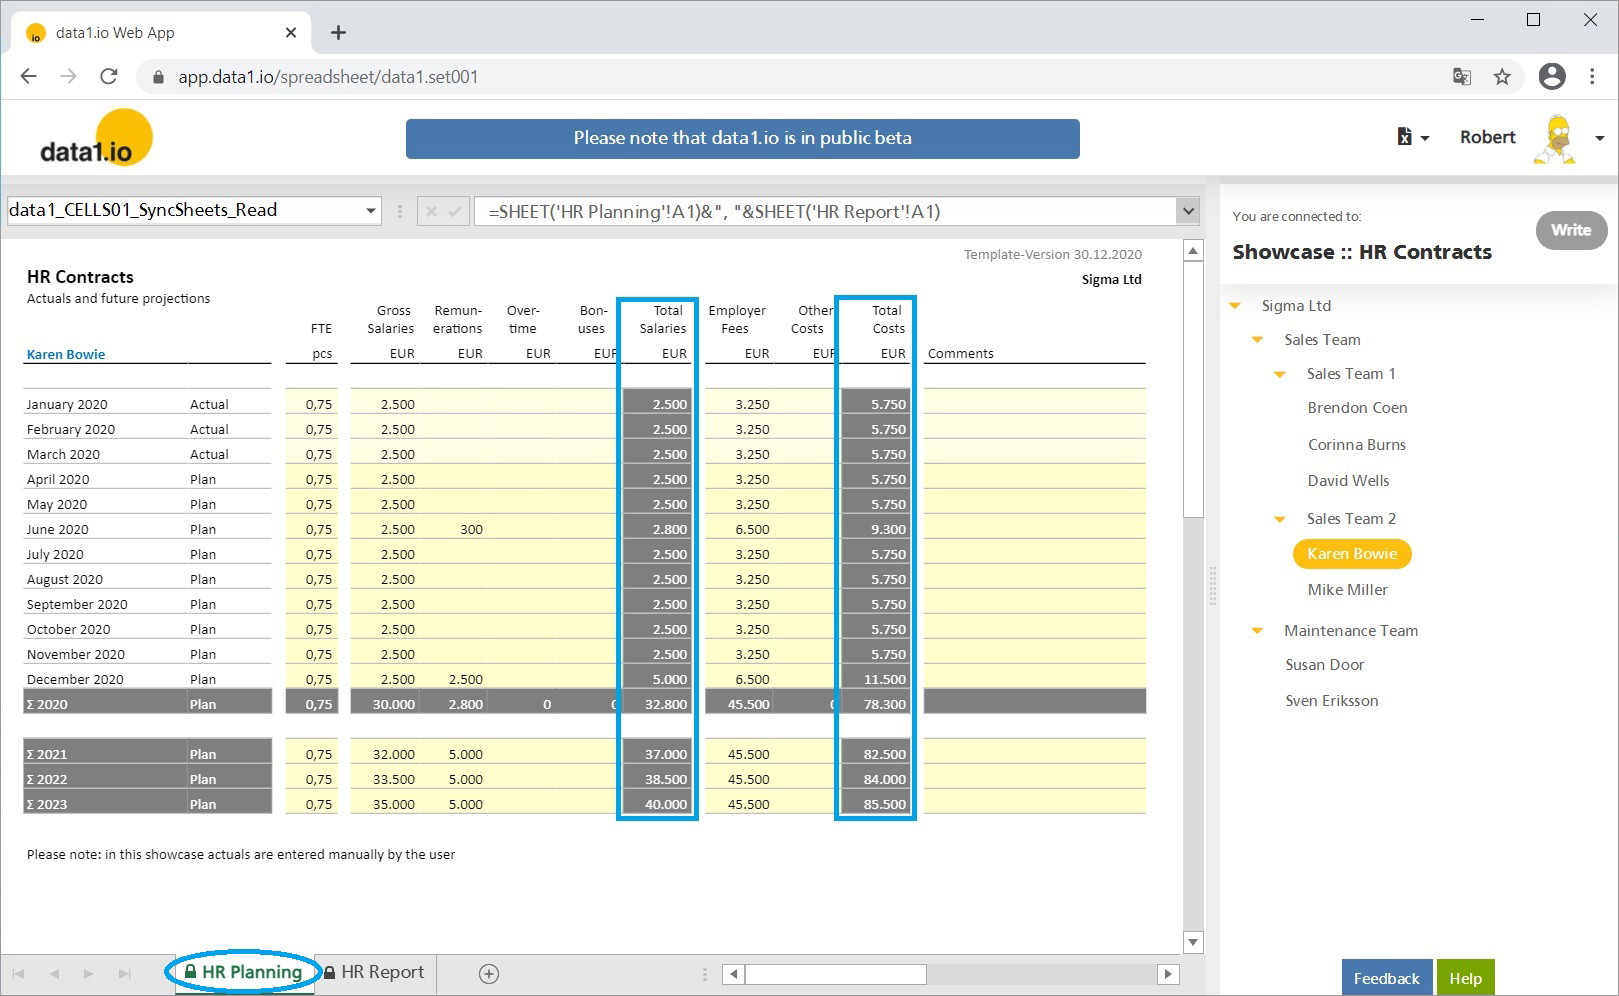
In the data entry sheet of a data1.io Template File we always enter data on the bottom level of each dimension (the elements on this level we call the “keys”). Totals and Subtotals can simply be created with Excel formulas:
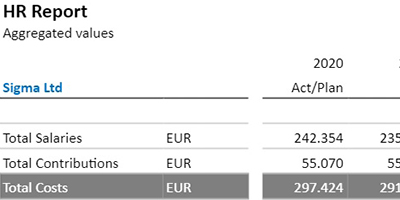
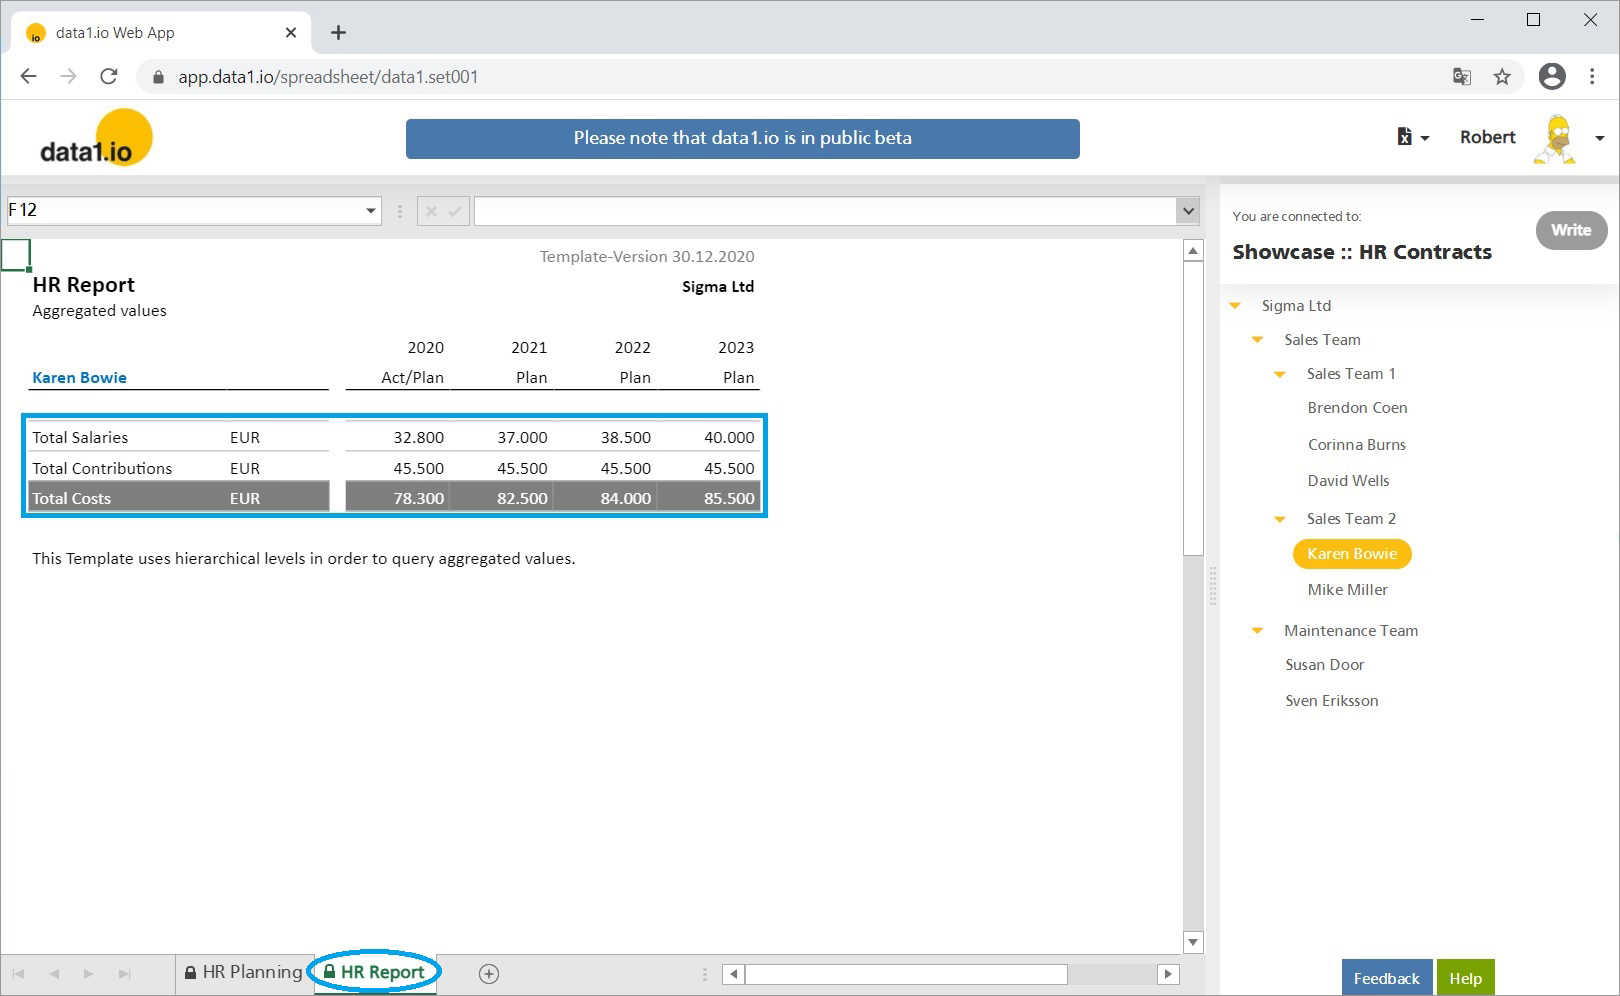
But in a report sheet it is often more effective to show aggregations instead of every single value on the key level. So a report for the “HR Contracts” could show only “Total Salaries” and “Total Contributions” as aggregations of the bottom level metrics:
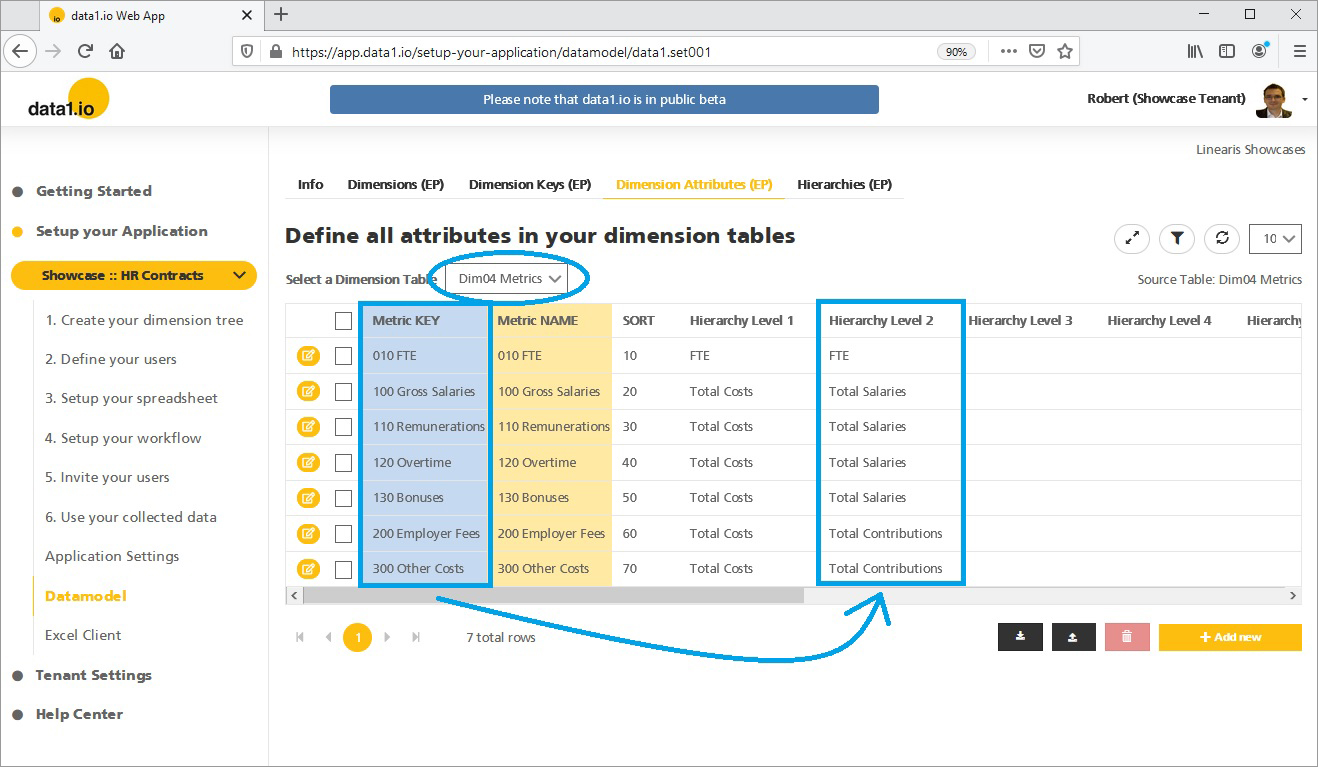
But how this can be achived without querying the single metrics in the background? At first we need to define so-called attributes in the data model. We will use the definitions in the “Hierarchy Level 2” for the aggregation queries in the next step:
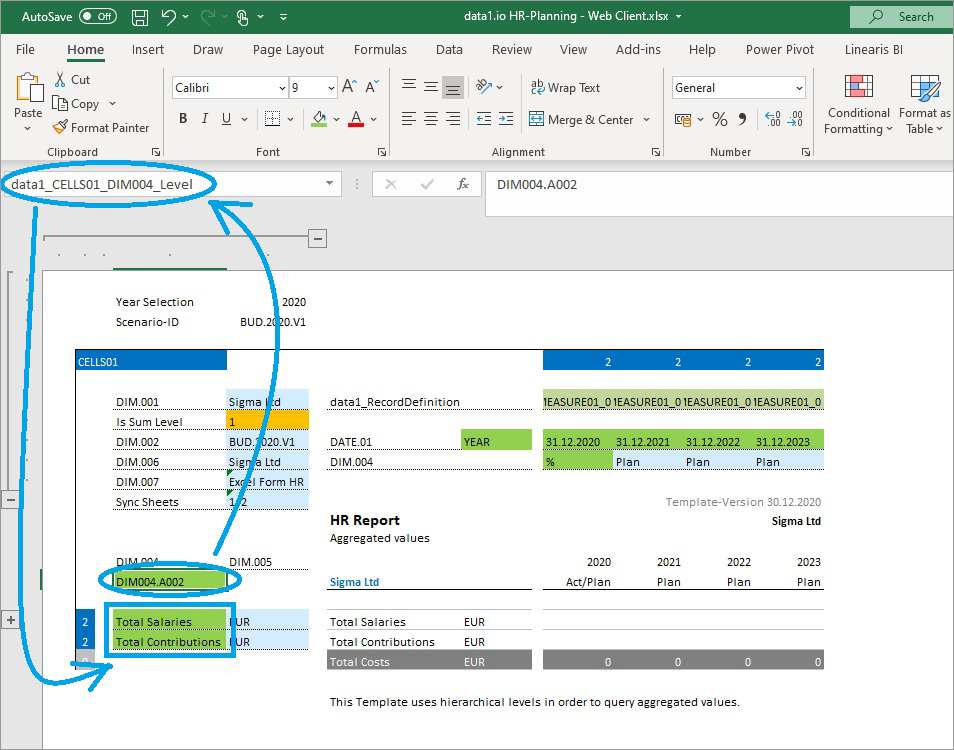
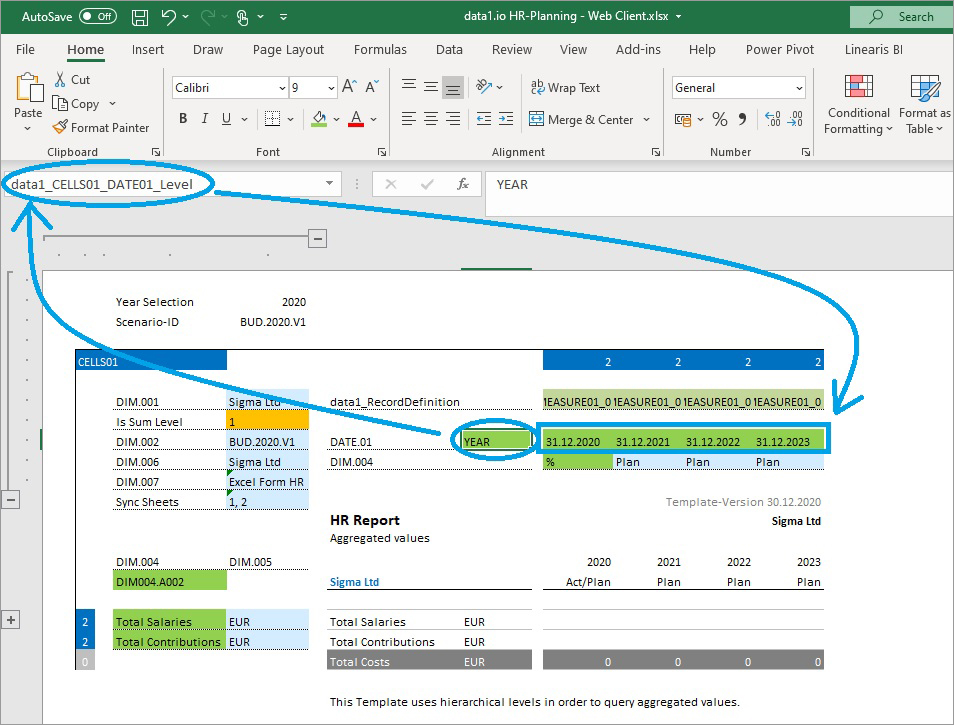
In the report sheet of the template file an additonal named range must be defined:
data1_CELLS01_DIMxxx_Level
This cell is filled with the technical column name of the attribute (“DIM004.A002”) and then it is possible to use the entries in this attribute column as query parameter for the row:
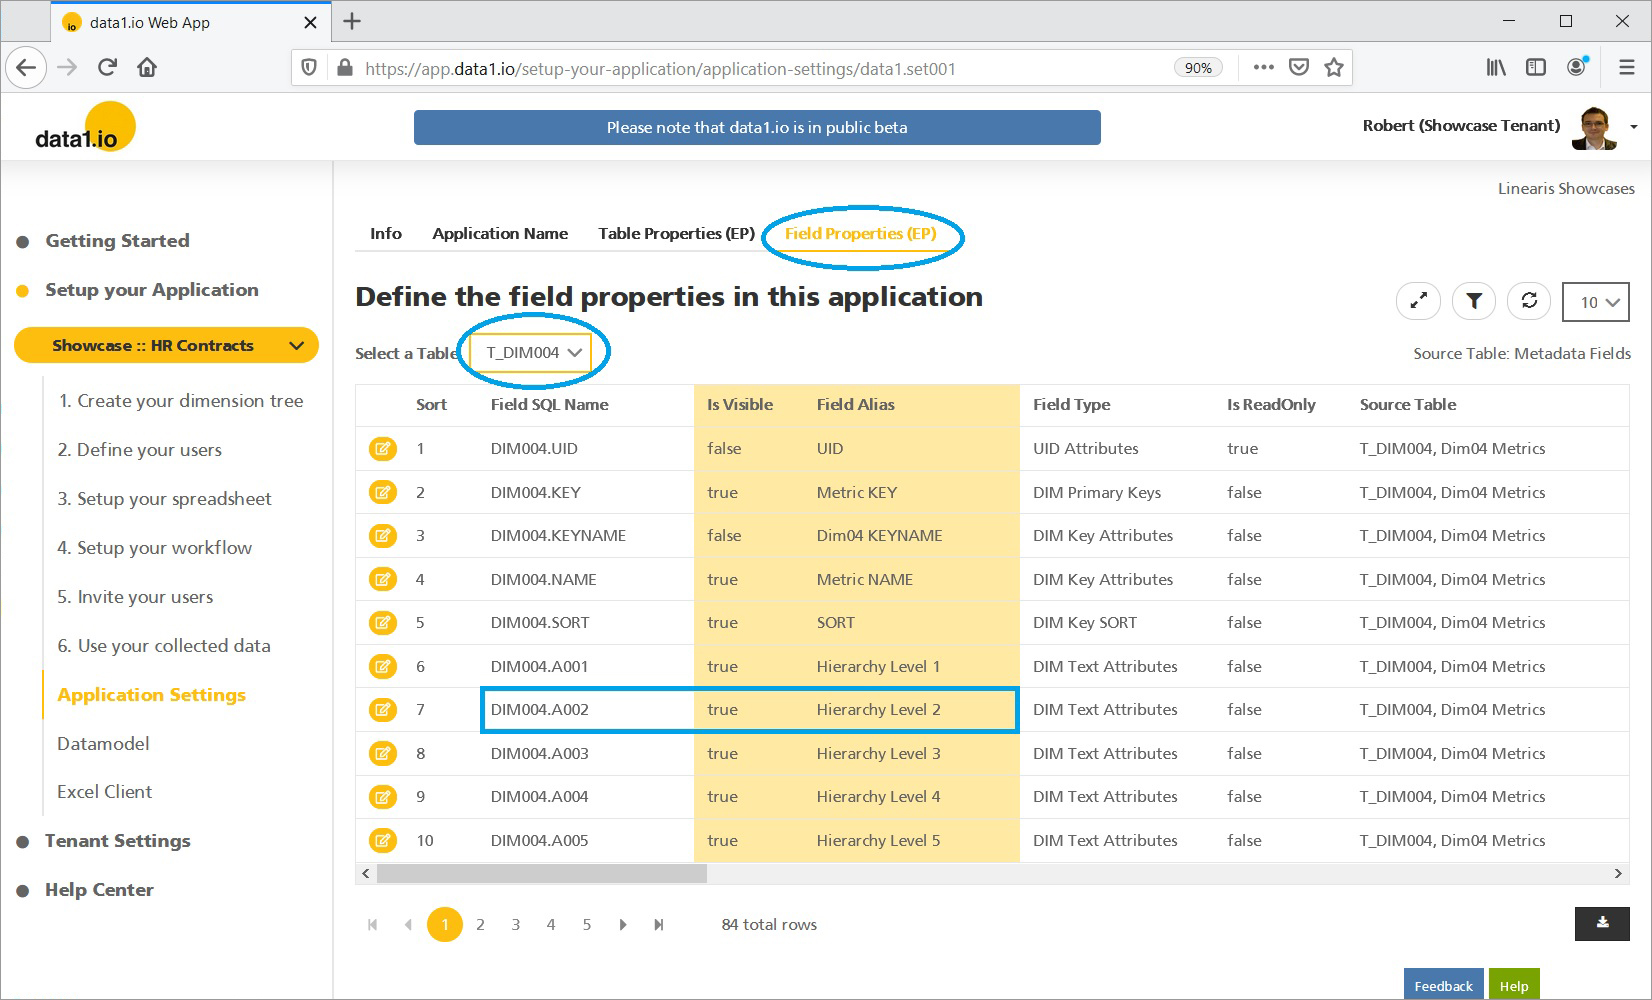
You`ll find the technical name of the attribute column in the “Field Properties”:
Please note that this feature can be used only with an Enterprise Plan since the definitions in the data model can only be set with the EP. Please also note that the use of the “Level”-definition makes a sheet read-only (the write-button in the dimension tree pane will not be activated any more in this sheet). Finally, please note that this feature is at the moment restricted to the first 5 attributes of a dimension.
(3) Web Client: Aggregation queries on virtual attributes of date fields
The same aggregation feature is now available for date fields:
It is very easy to use. Simply set the named range
data1_CELLS01_DATExx_Level
and set one of the 3 available default aggregation keywords:
YEAR
QUARTER
MONTH
Please note that in the DATExx panel there must be an entry with date format (“31.12.2020”) and not only the year (“2020”). For a YEAR aggregation you can use any date in this year, for a QUARTER aggregation any date within this quarter and for a MONTH aggregation any date within this month:
This feature can be used also with the Free Plan since there are no definitions needed in the data model. Please note that the use of the “Level”-definition makes a sheet read-only (the write-button in the dimension tree pane will not be activated any more in this sheet).
(4) Showcase “HR Contracts” with new report sheet
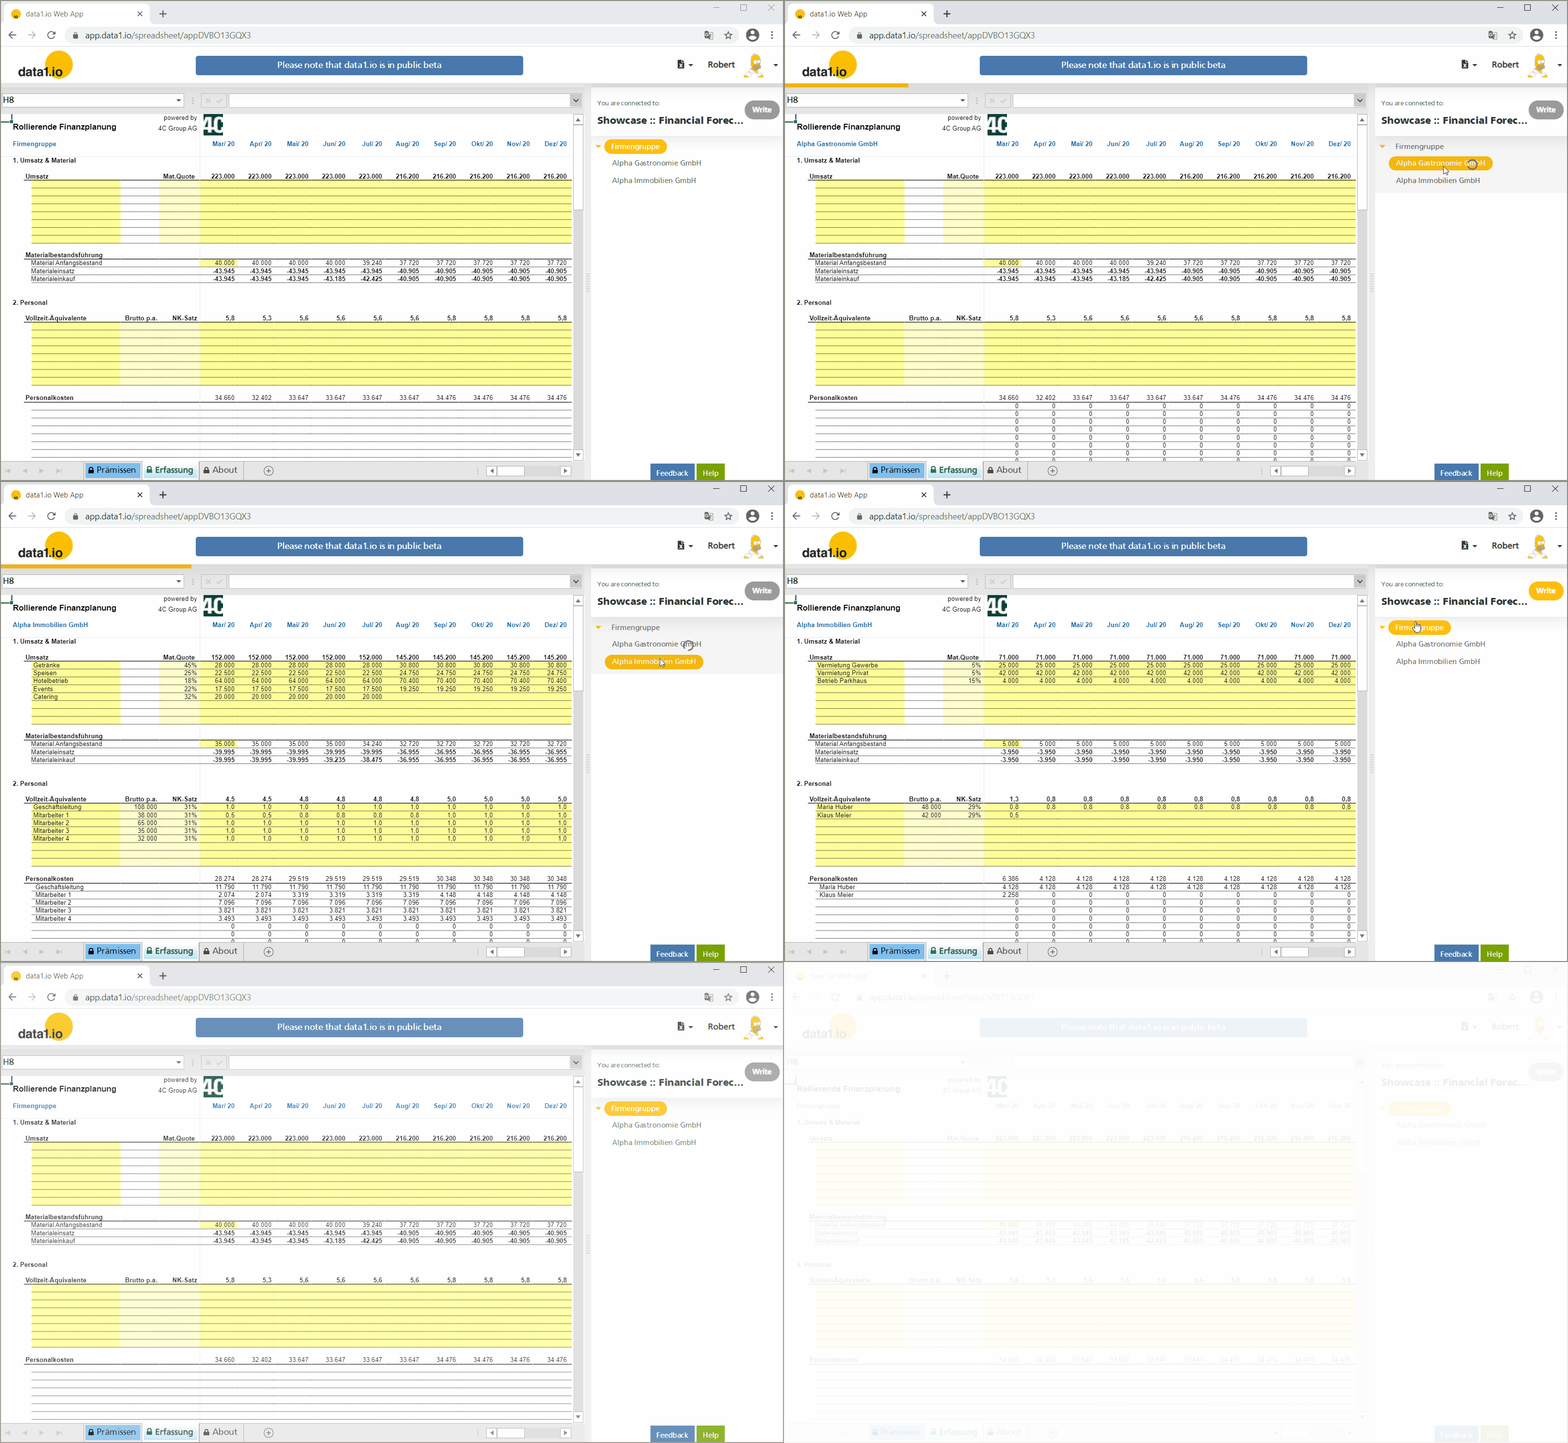
As you already have seen in the new aggregation query features above we have updated our public showcase for HR Contracts with a second sheet which is only for reporting. This showcase now uses a multi-sheet template as well, one sheet for data entry and another sheet for aggregations. Both sheets are synced, i.e. the double click in the dimension tree triggers the READ process always in both sheets:
We have made improvements and debugging with the new comment function, the new data validation function as well as in “Cell mode”. Furthermore we made improvements in the loading bar in synced multi-sheet Templates.
Hope you like the new features – we are very curious about your feedback! Please let us know what you think and what kind of collection processes you would prefer to automate with data1.io.
And: stay healthy and wish you a Happy New Year!
https://data-one.cloud/wp-content/uploads/2020/12/December-2020-Release-Title.jpg200400Robert Lochnerhttps://data1.io/wp-content/uploads/2021/06/data1.io_Logo_Black-Orange-184-x-300-300x184.pngRobert Lochner2020-12-30 18:10:052020-12-31 08:43:03Release December 2020
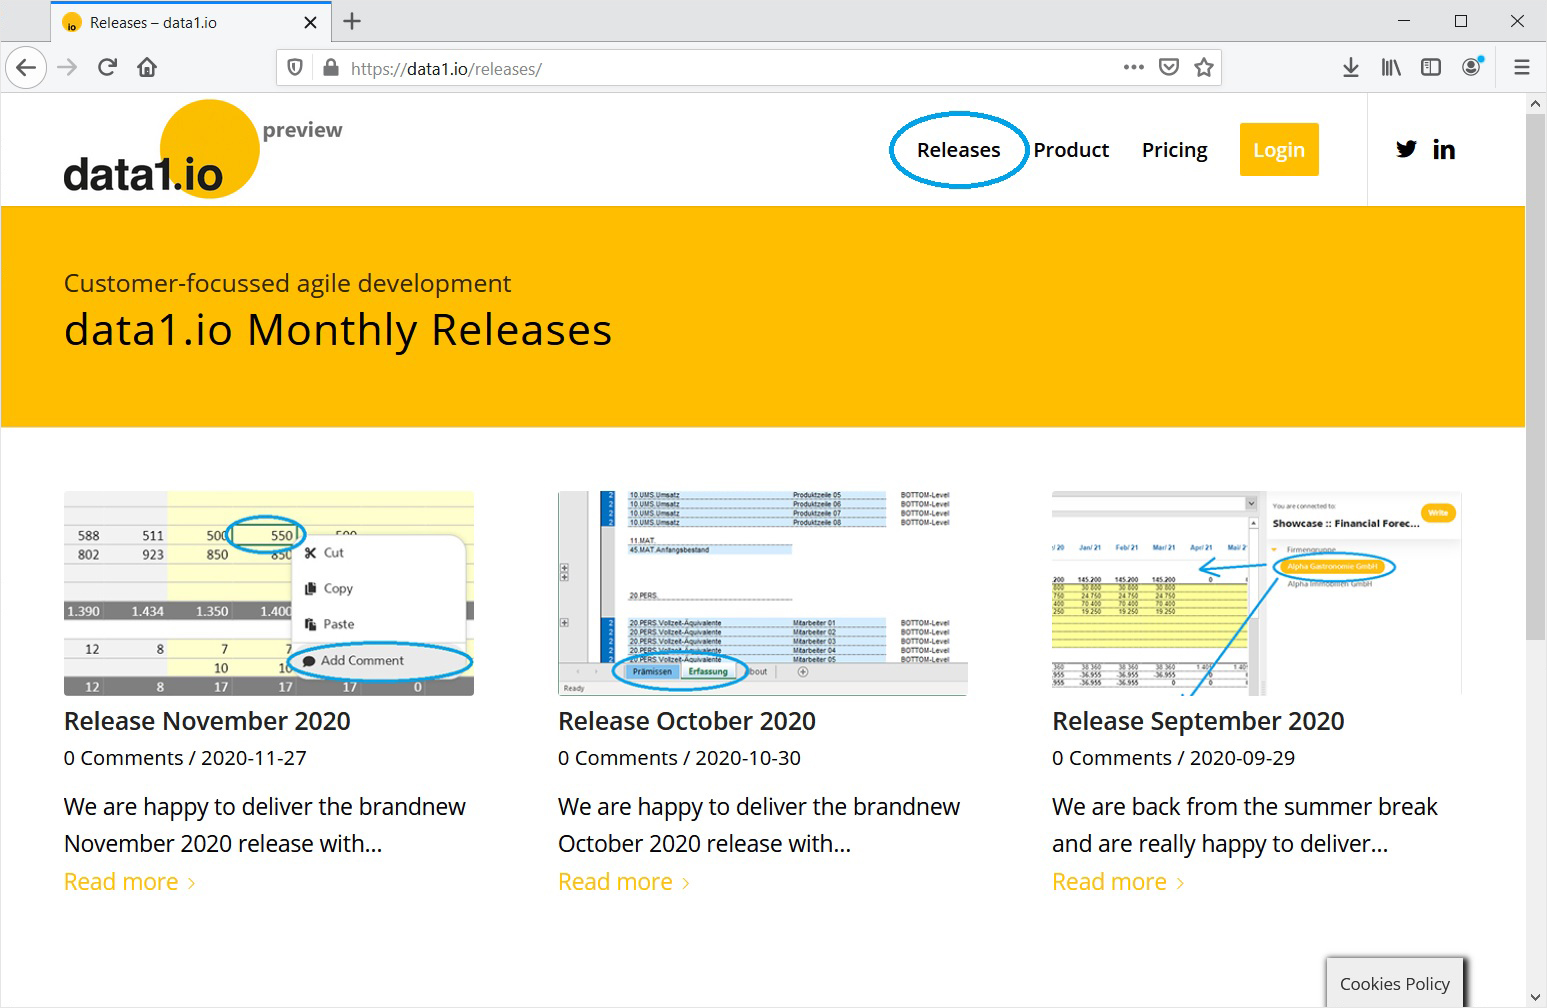
We are happy to deliver the brandnew November 2020 release with the new comment function and major organizational improvements. Try it now!
Remember, the Web Client is the user friendly interface for your Collector Users to deliver their monthly/weekly/daily data. The Web App is the tool for the Power User to setup and control your organization’s collection workflows.
(1) Web Client: New comment function
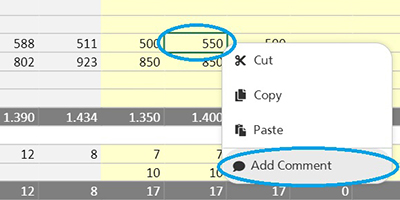
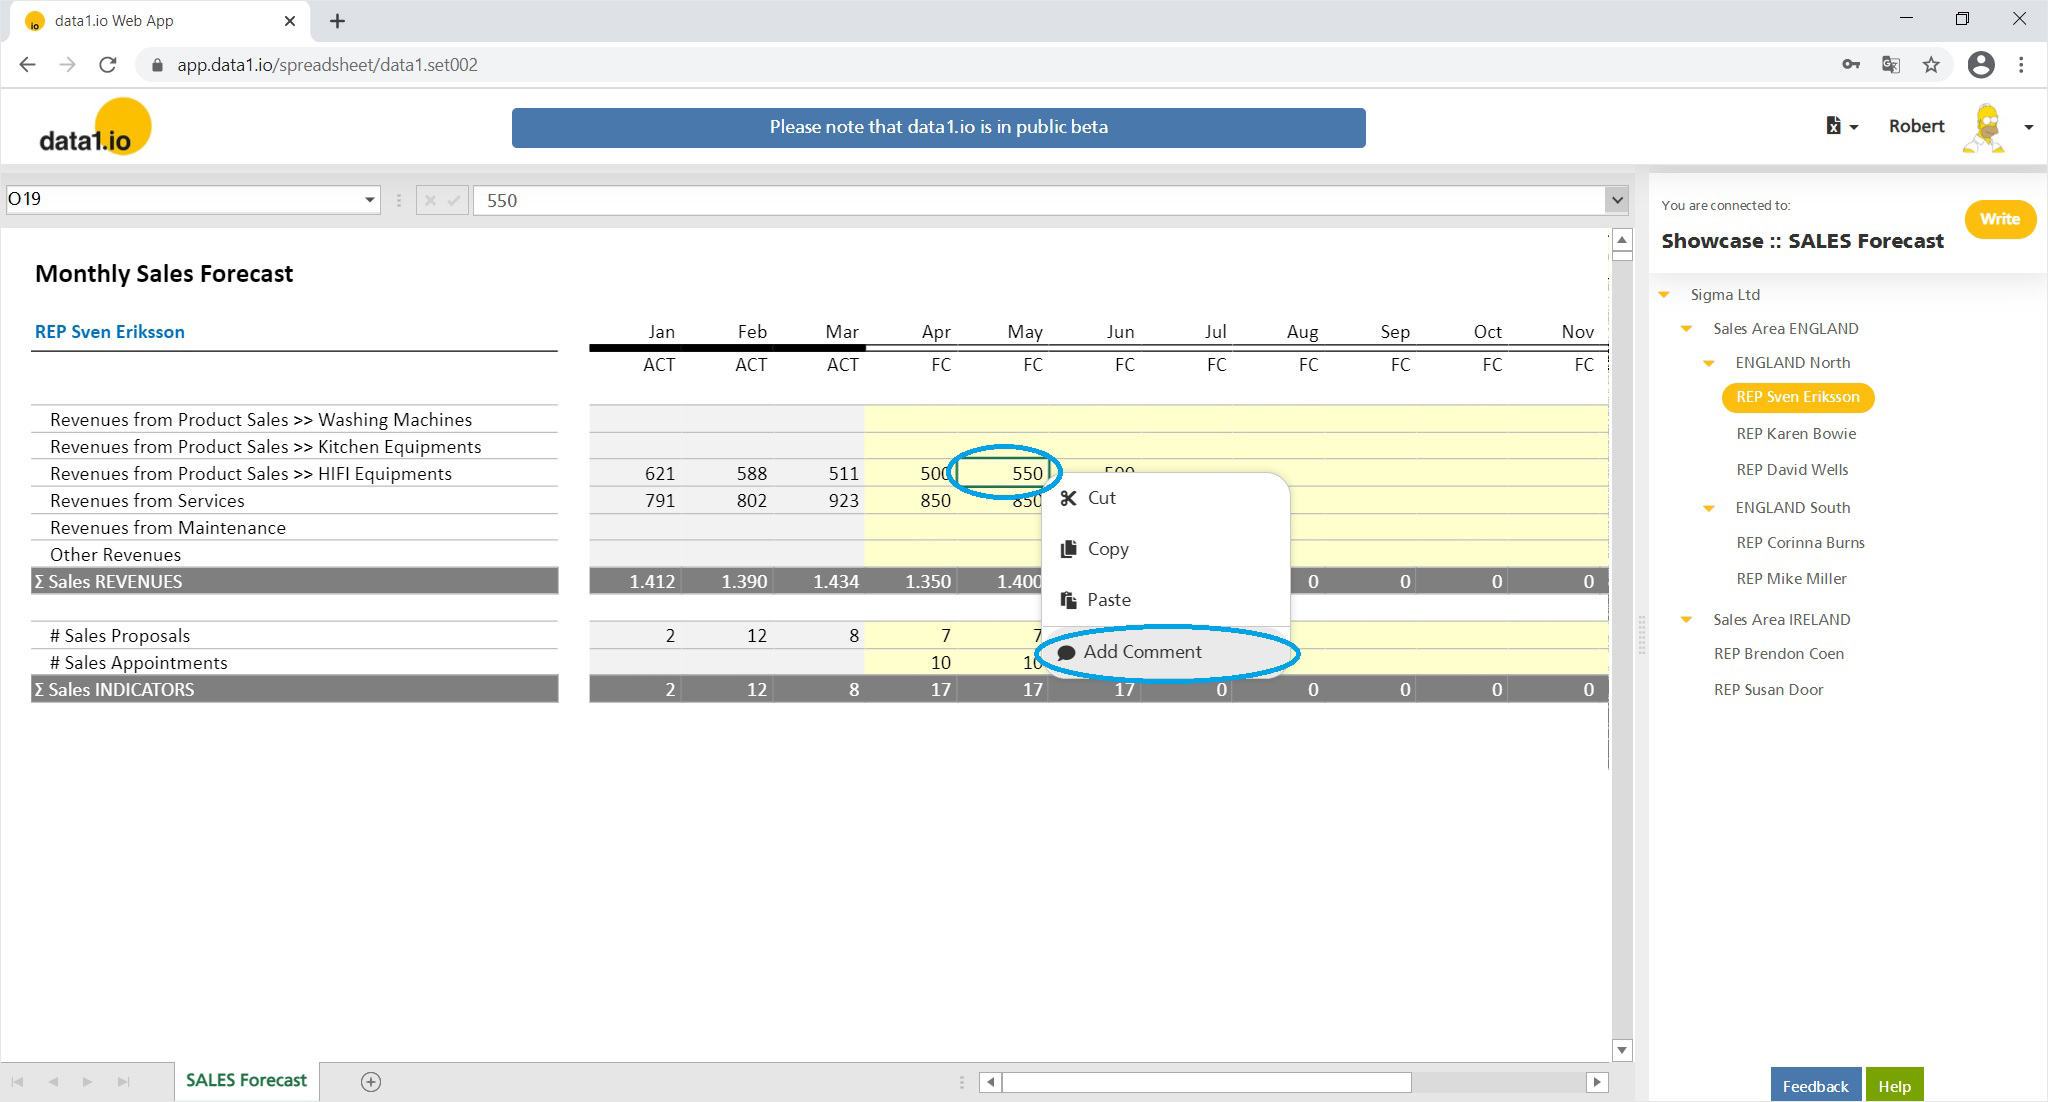
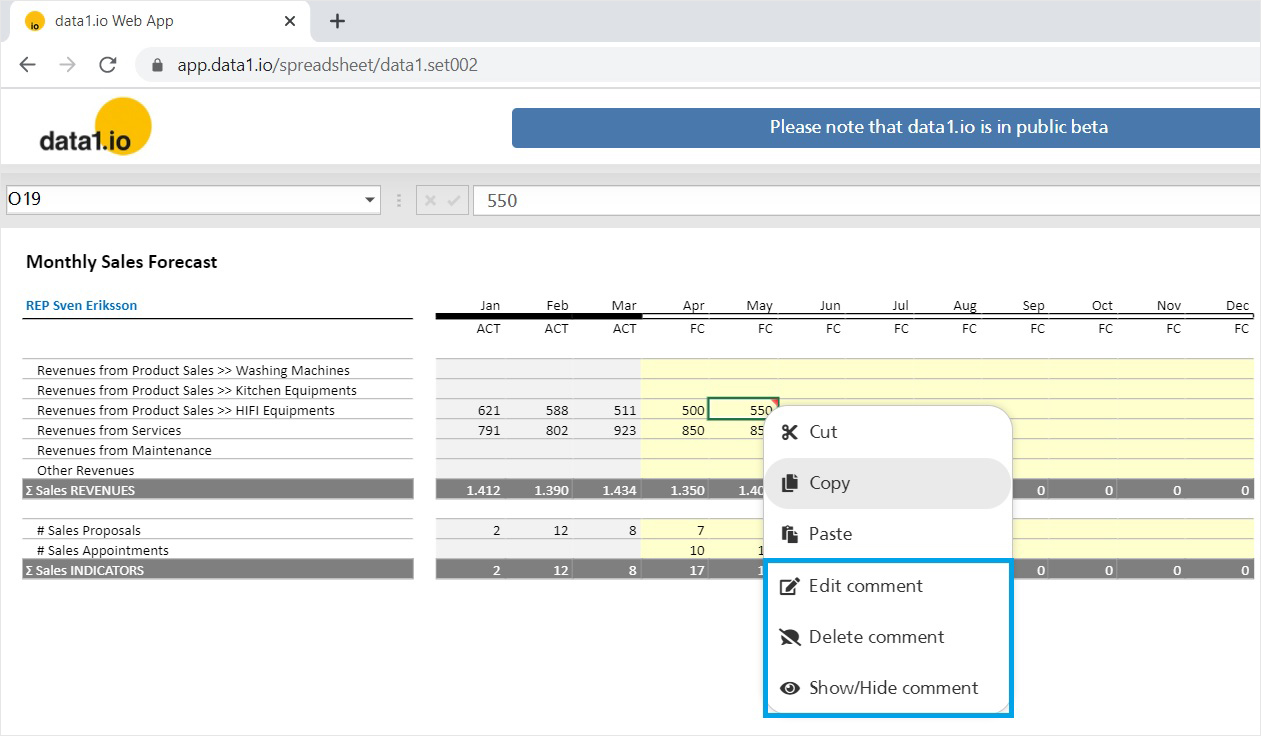
Probably everyone knows the “good old” comment function in Excel – from now on you can use this function in data1.io as well. Simply right click on a cell and select Add Comment …
… and enter your comment in the yellow comment box. After clicking the Write button not only the data but also the comment will be saved to your Fact Table:
Of course already existing comments are a shown after the READ process with the well-known red marker in the corner of the cell with the comment:
Every comment can be edited and/or deleted (do not forget to press the Write button to bring the changes into your application). Furthermore comments can be shown permanently with the Show/hide comment function.
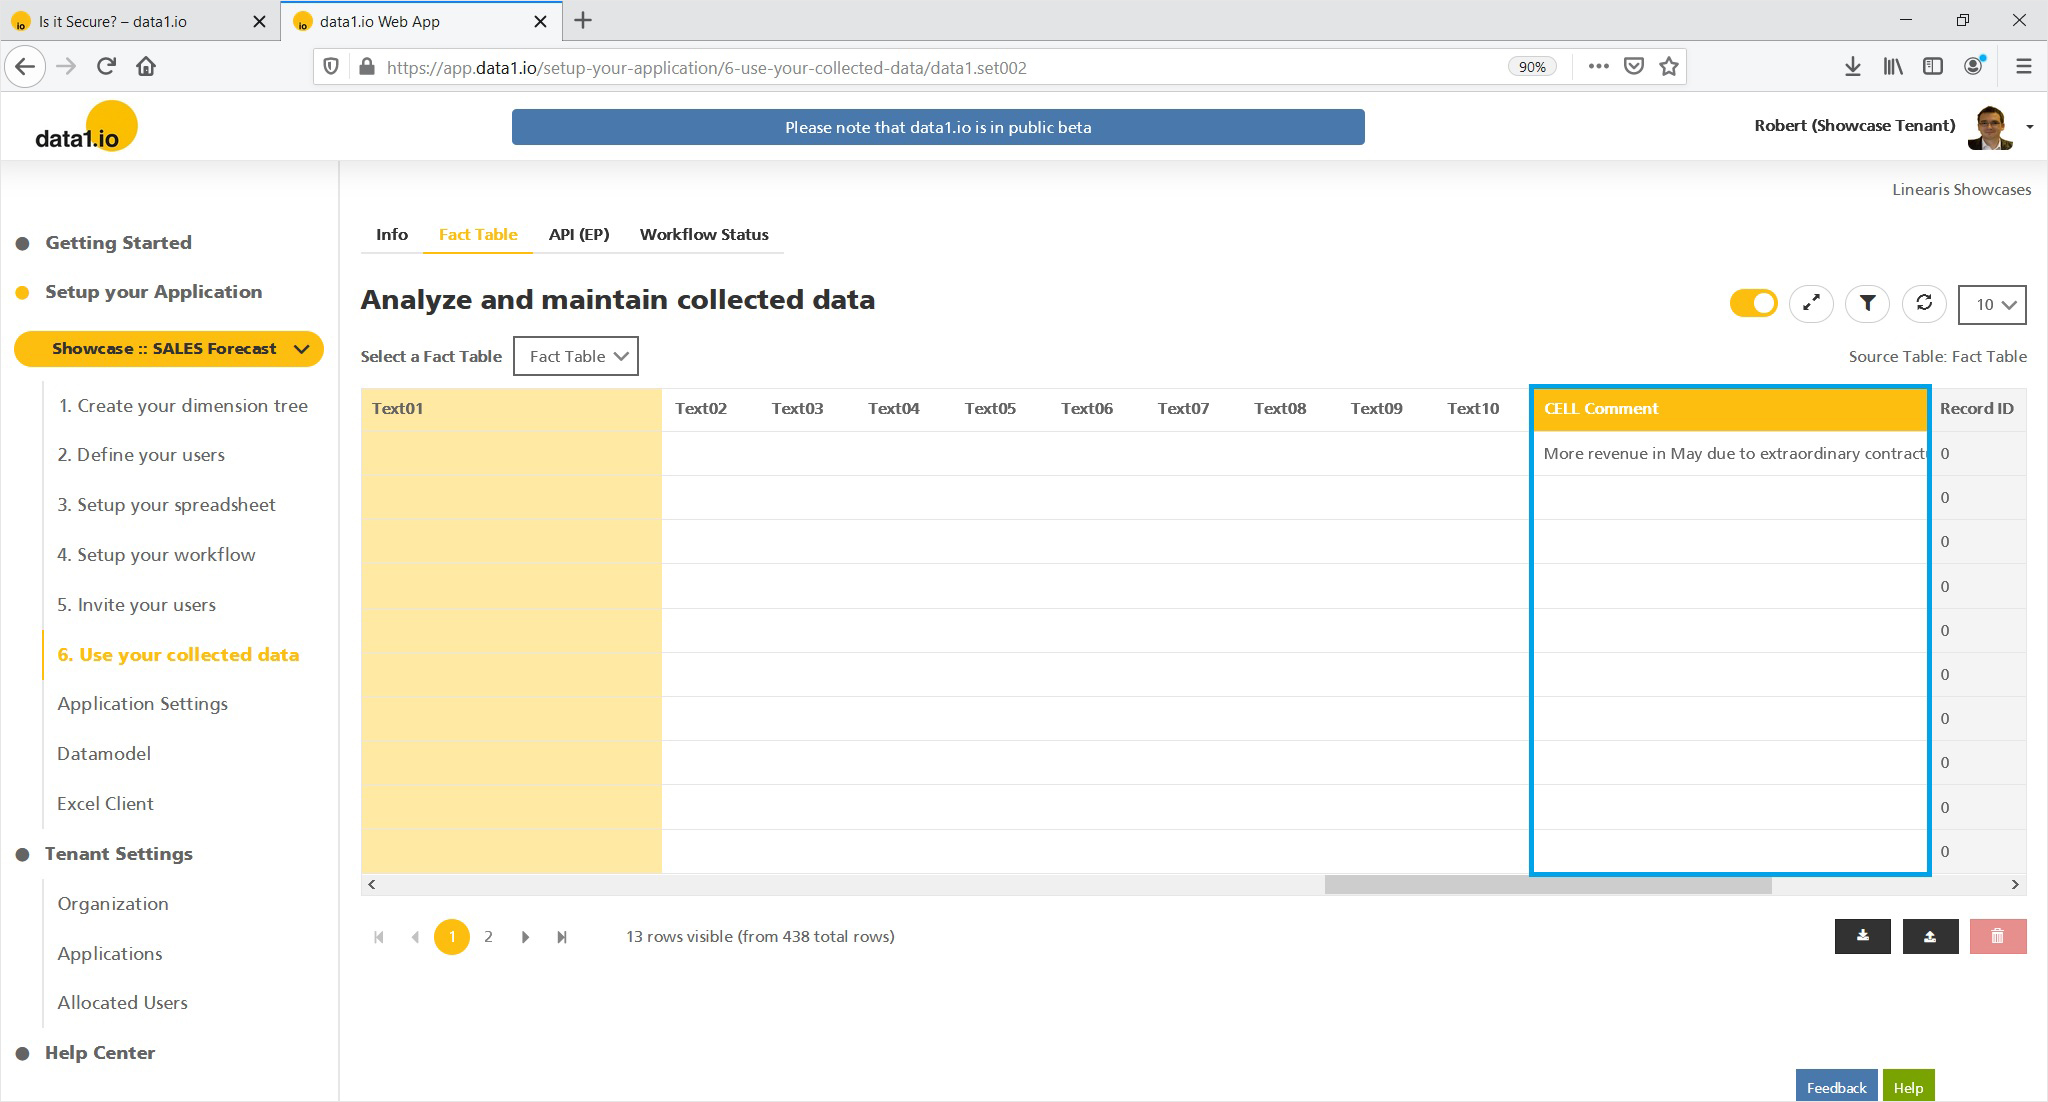
On fact table level the comment can be found …
… in the new column CELL Comment:
(2) Web Client: New datatype validation
We have implemented the datatype validation into the Web Client which is already known from the Excel client. The datatype is derived from the field in the Fact Table where the data will be written.
If your Collector Users try to enter some text into a cell that is written to a Measure-Field in the Fact Table …
… then they will get an error message due to the invalid datatype:
Please note that the cursor in the background was automatically set to the cell with the invalid data.
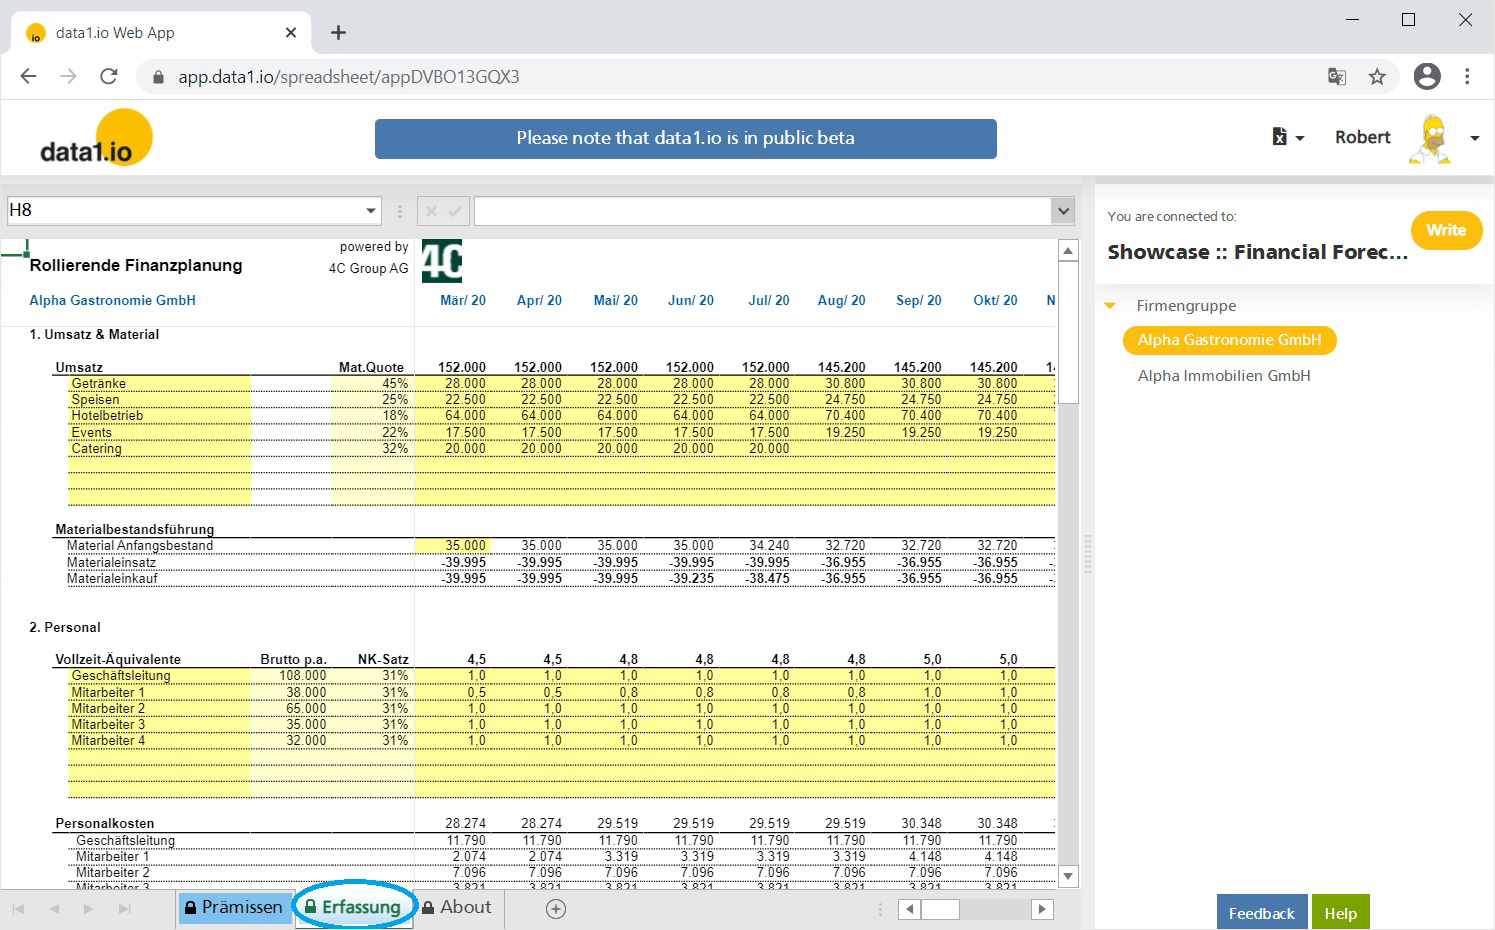
(3) Showcase “Financial Forecast” with new multi-sheet feature
After introducing the Multi-Sheet Mode in last month`s October 2020 Release we activated this feature now in the Showcase Financial Forecast to extend the existing planning sheet called Erfassung …
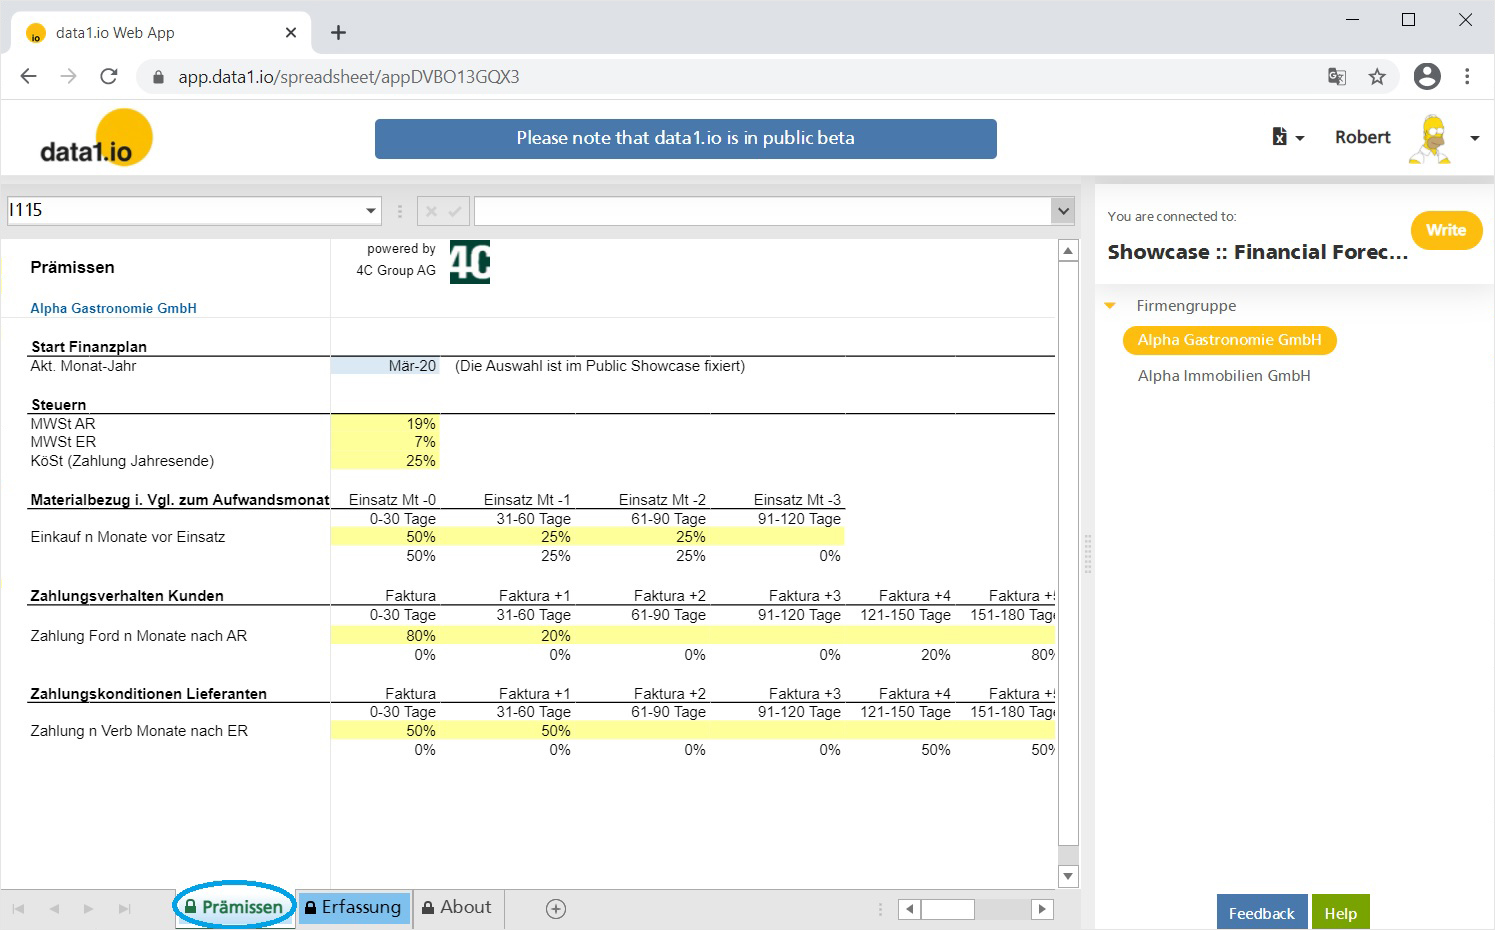
… by an additonal sheet called Prämissen to set company specific calculation parameters:
The two sheets are synchronized, i.e. a READ or WRITE process in one sheets triggers always the same process also in the other sheet.
Please note that this showcase is implemented in german language.
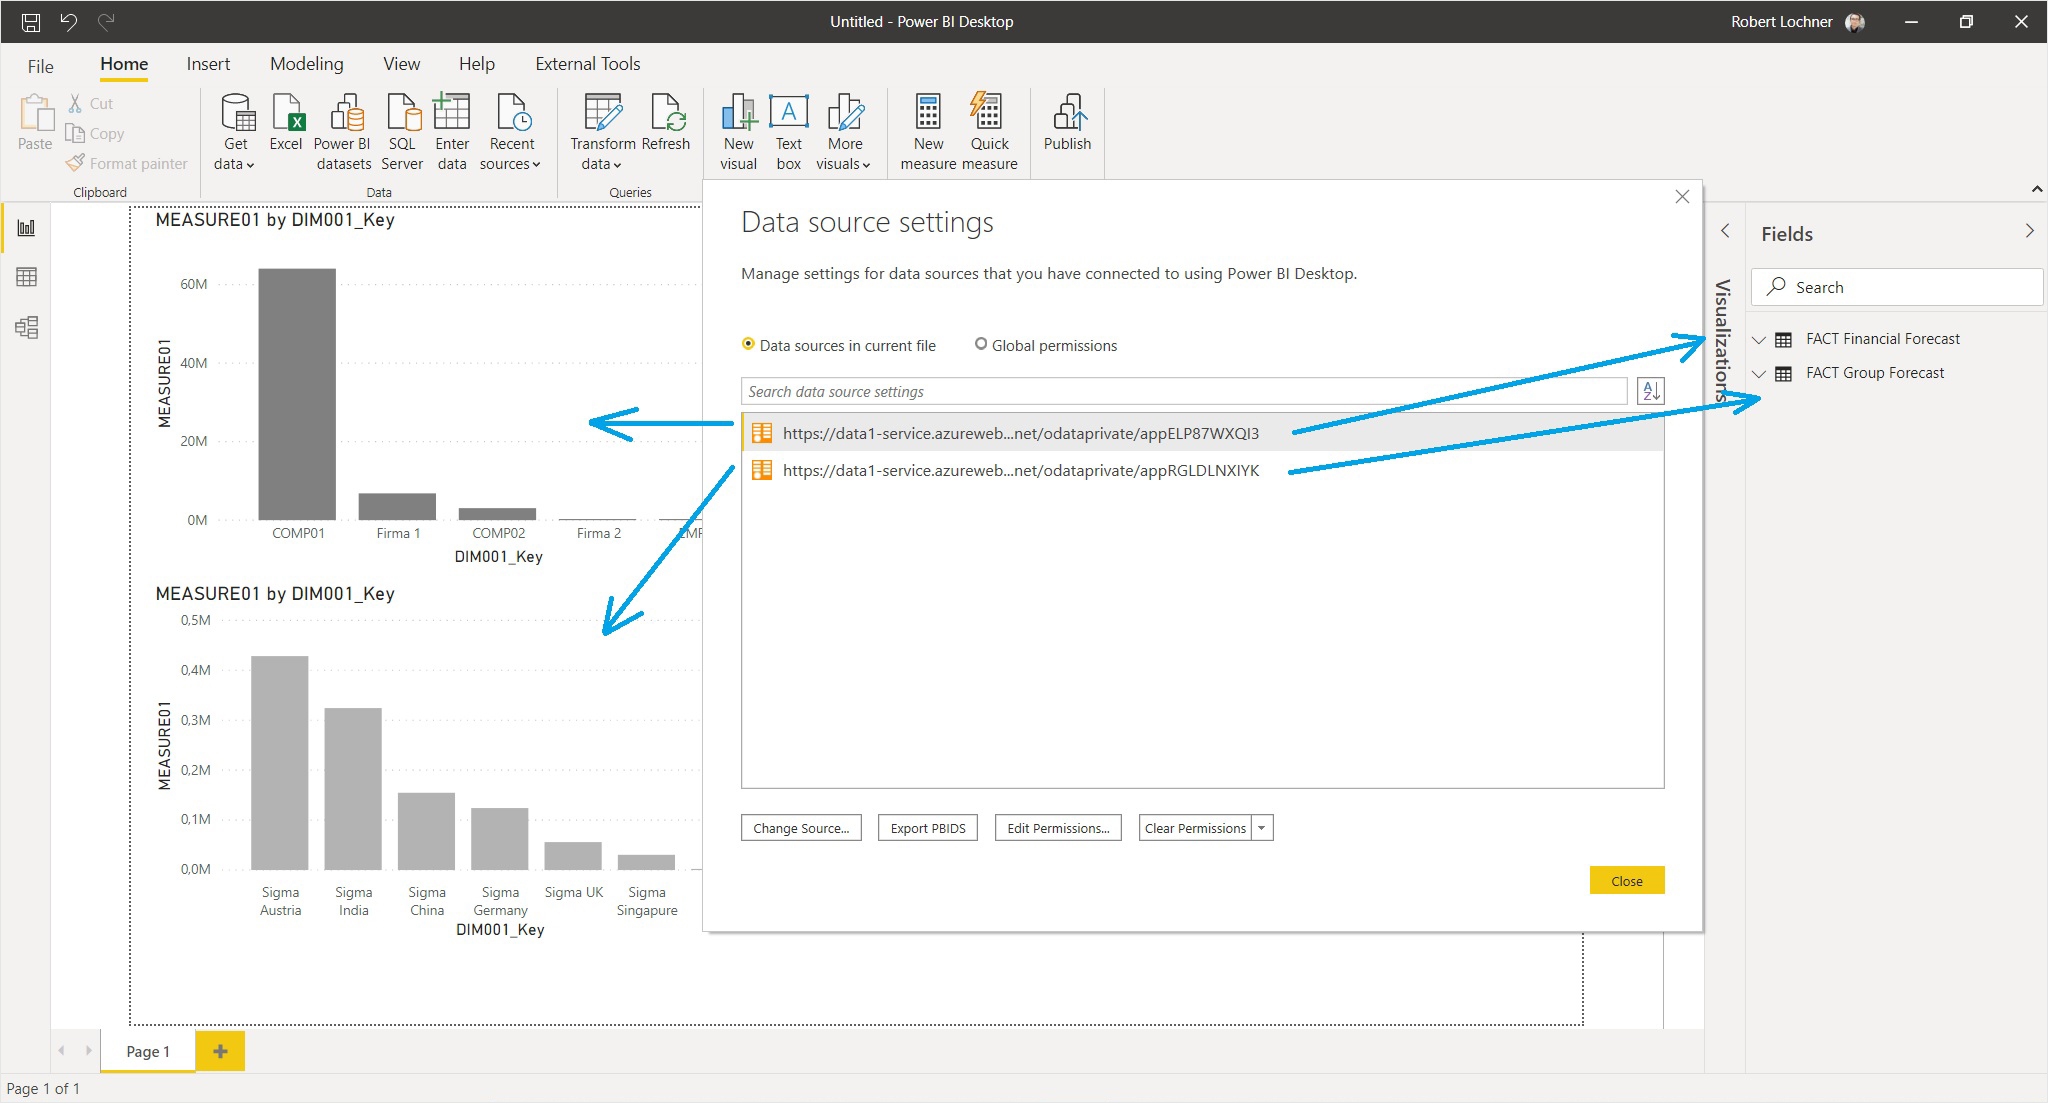
(4) Enterprise Plan: Improved ODATA URL
Until now it was not possible to combine several ODATA-Feeds (to several private data1.io applications) within the SAME Power BI or Excel Power Query application. We changed that now by an improved ODATA URL and an improved background architecture so that you create now your Mashups with as many data1.io ODATA feeds as necessary for your Dashboard:
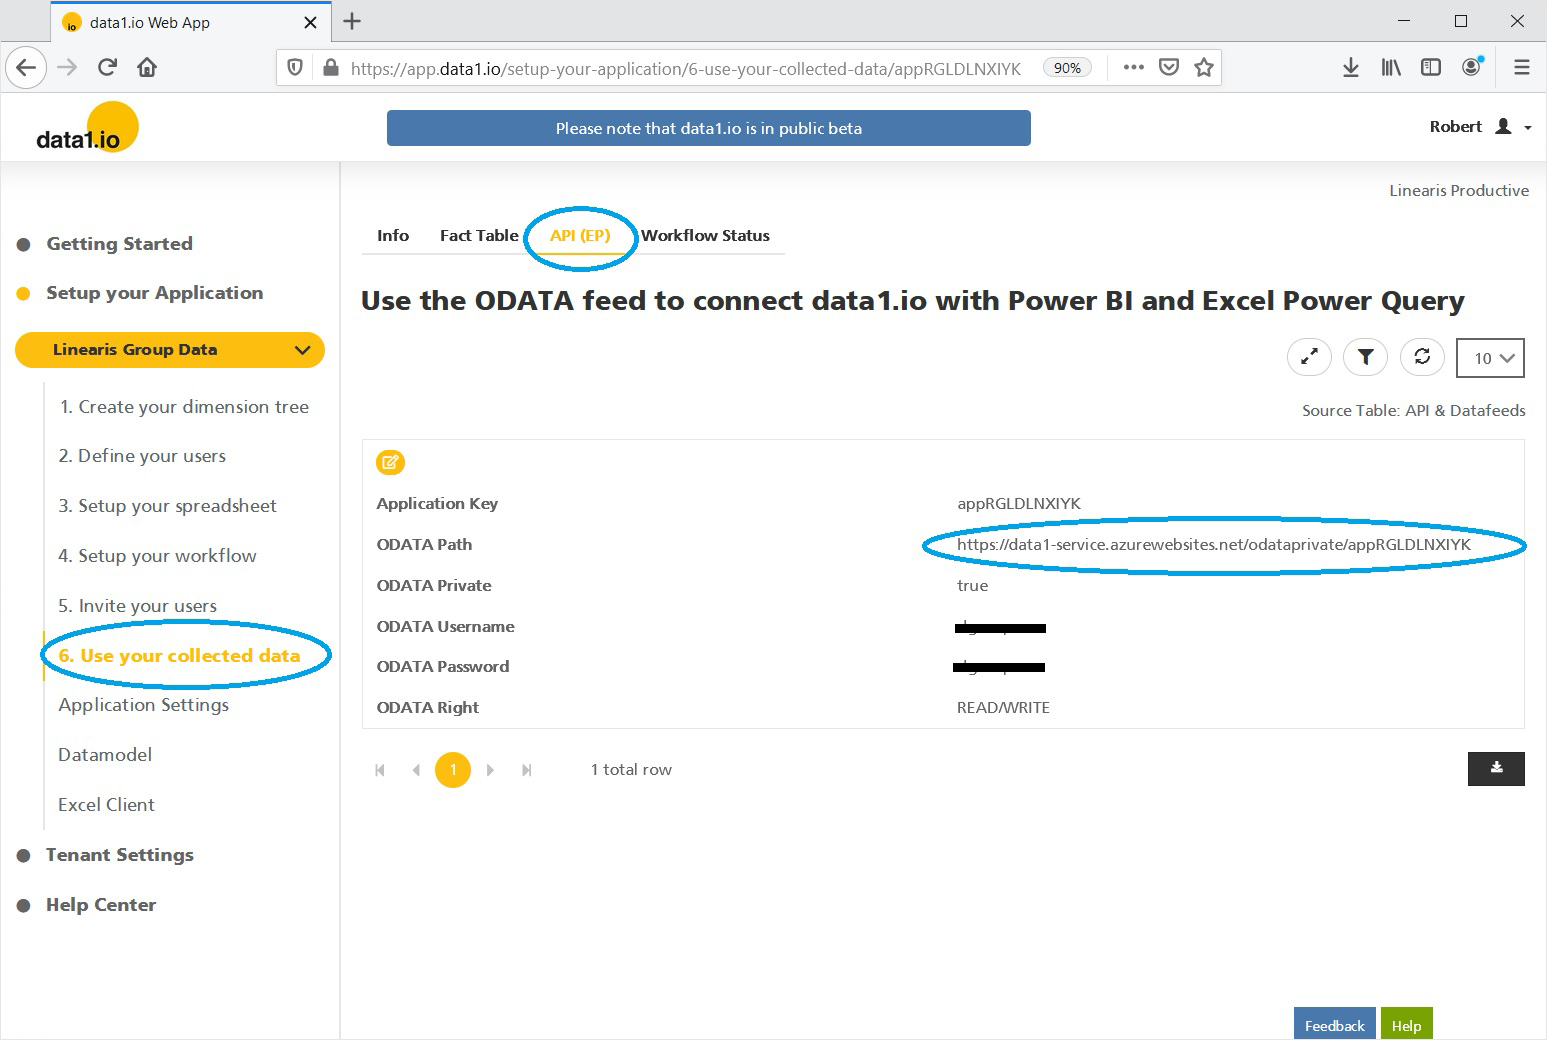
Just to remember: you`ll find your private ODATA URL here:
Please note that the ODATA Feed is an Enterprise Feature.
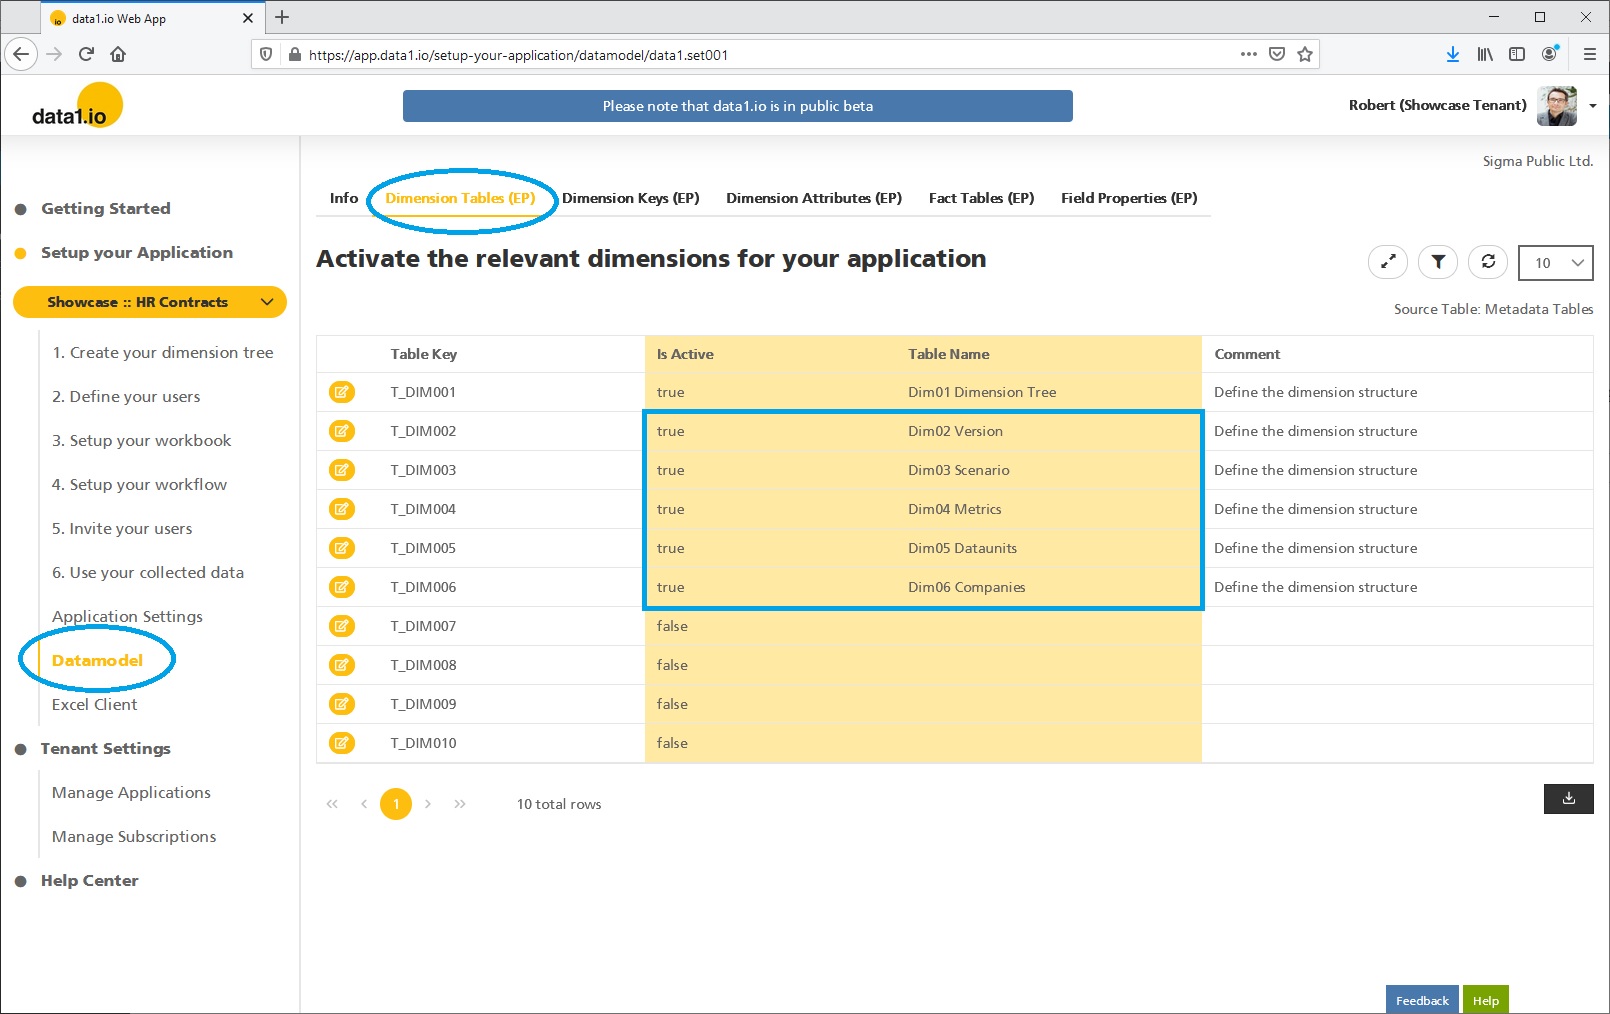
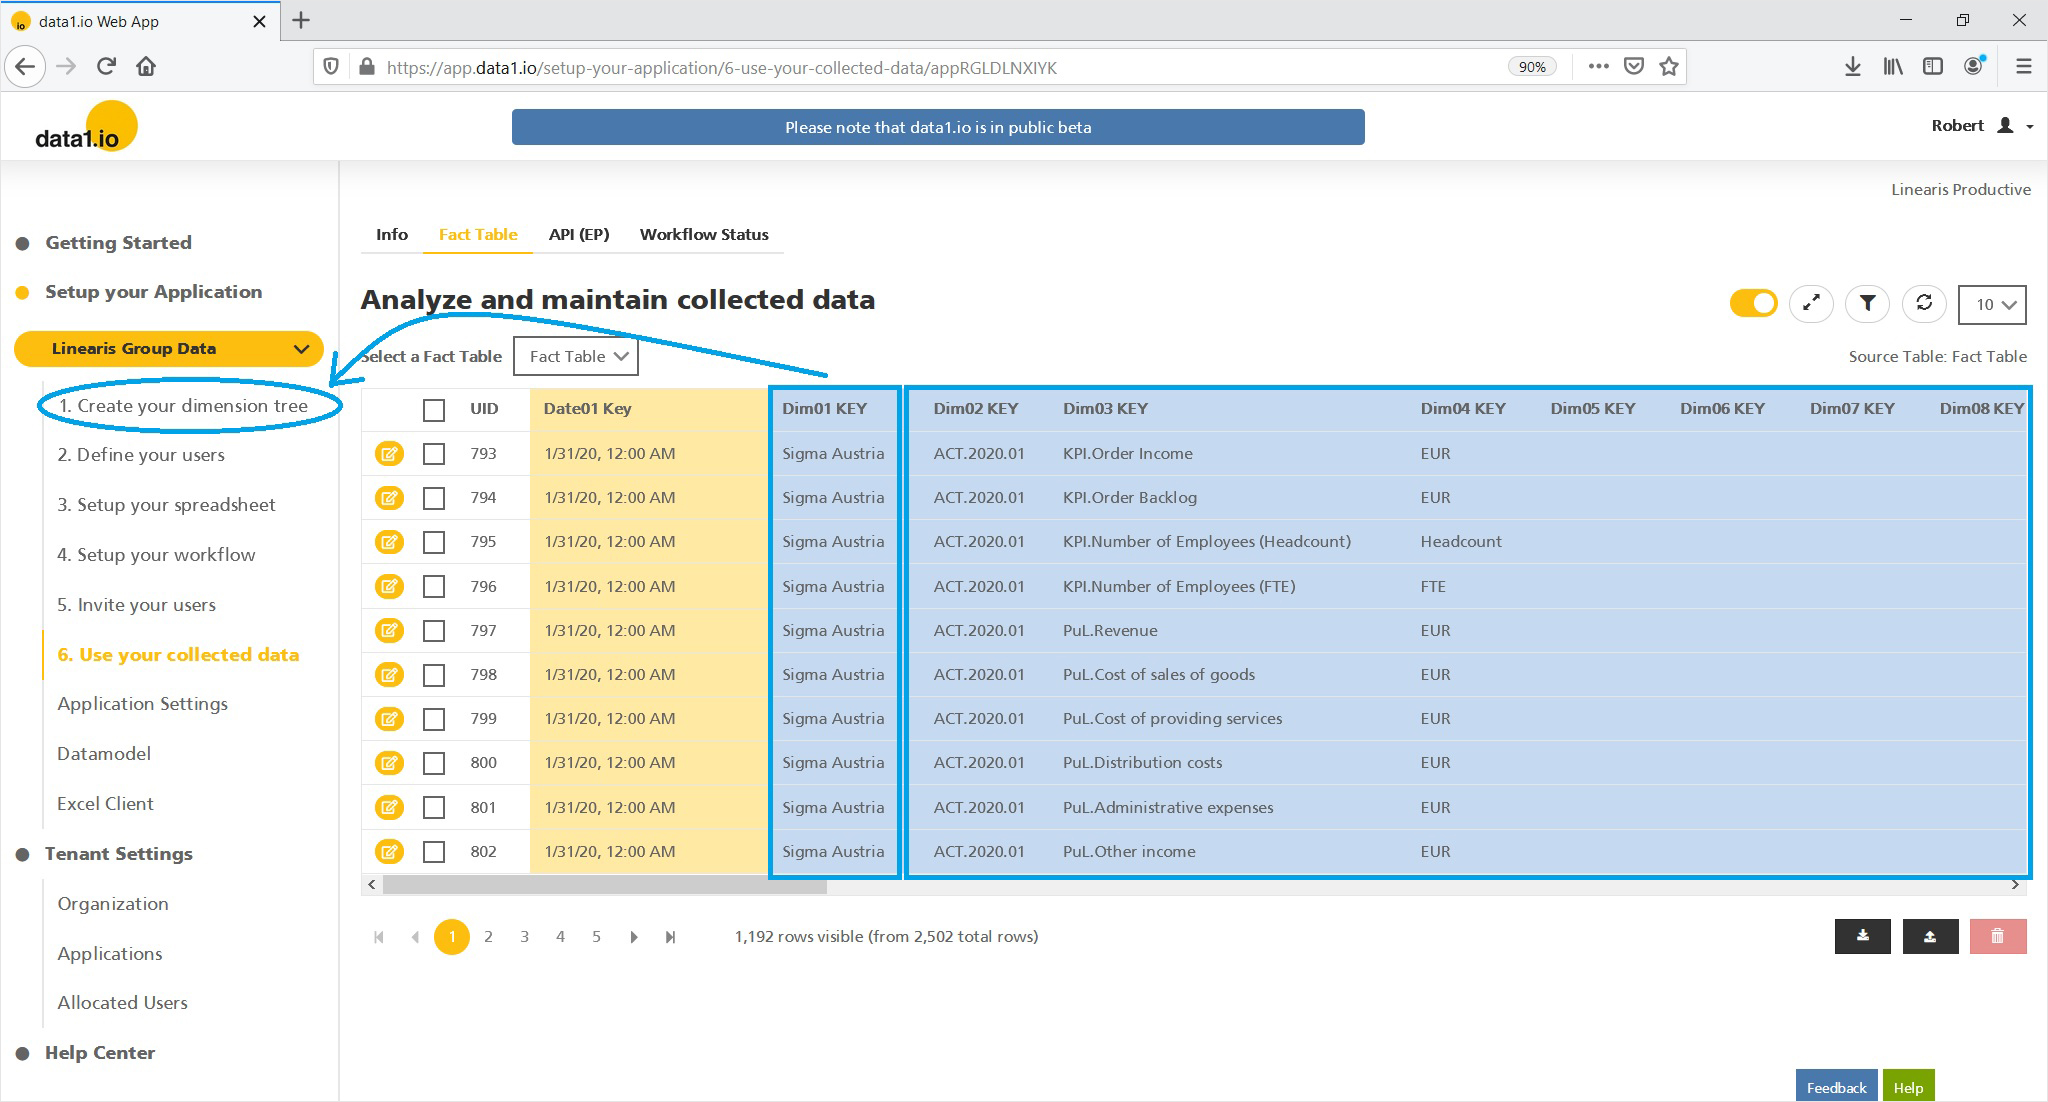
(5) Enterprise Plan: Additional Dimension Tables
You already know from your Fact Table that your datamodel has 10 Dimension Keys, but only the first dimension (Dim01) is used for the dimension tree and therefore can be defined in the menu item “1. Create your dimension tree”. But what about the other 9 dimensions?
With the menu item Datamodel you can activate every other dimension table needed. Furthermore you can give your dimension tables custom table names:
Please note that the Datamodel is an Enterprise Feature.
(6) Organizational: Update for our legal framework
We have updated our legal framework:
Privacy Policy – valid for all registered users and website visitors
This was necessary due to the evolution of our software and in order to be 100% consistent with current legal requirements in the European Union.
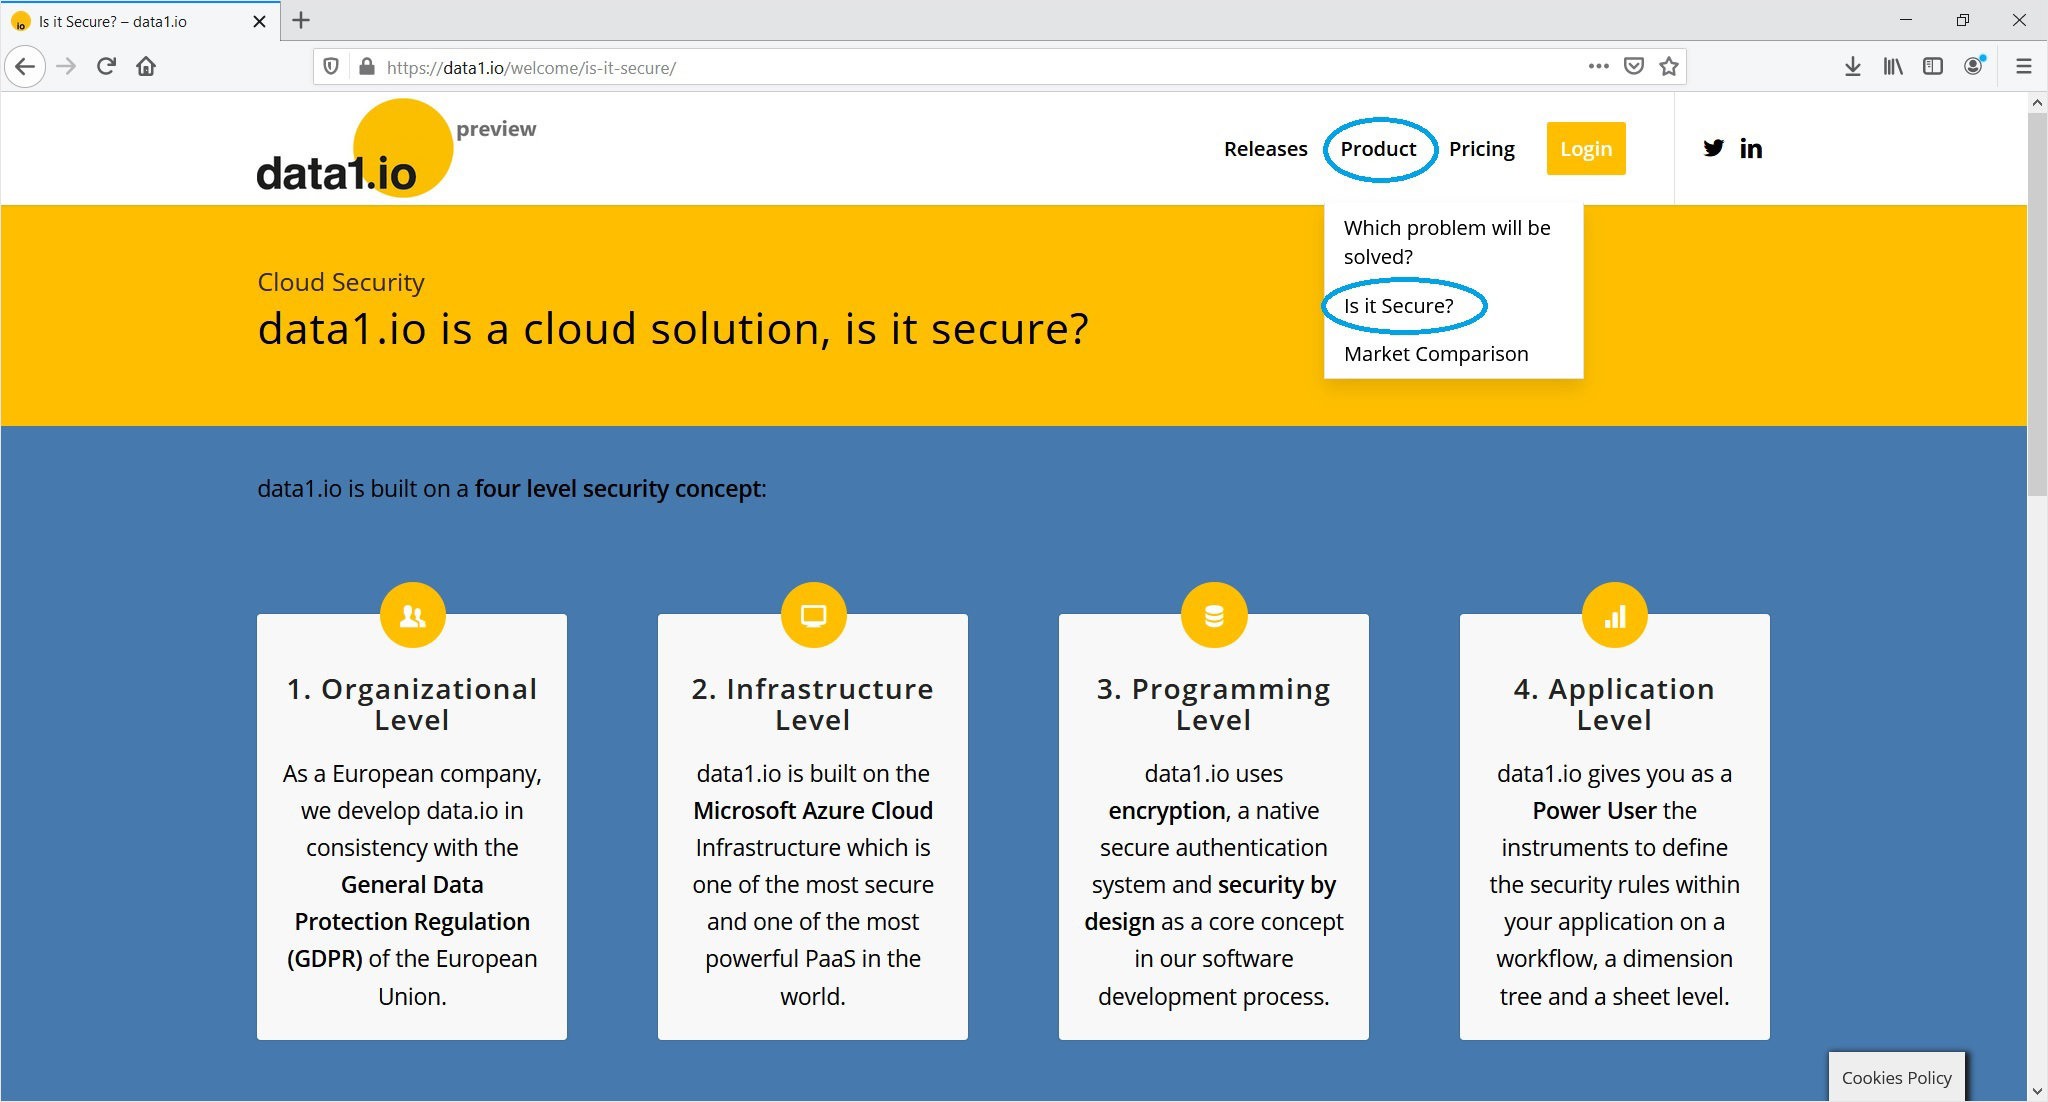
(7) Organizational: New webpage “Is it secure”
We have created a new webpage answering the question how security is handled in the data1.io service:
(8) Organizational: Monthly Release Notes moved to our website
Finally we have moved these monthly release notes from our Help Center to our Website in order to get more visibility for the monthly release news:
(9) Organizational: General Update for our Website
Last but not least we have streamlined and updated our overall website www.data1.io. The whole content is now focussed on the new Web Client (and not the former Excel Client), the showcases moved from subpages directly to the landing page and the pricing table moved to a seperate pricing page.
Hope you like the new features – we are very curious about your feedback! Please let us know what you think and what kind of collection processes you would prefer to automate with data1.io.
And: stay healthy!
https://data-one.cloud/wp-content/uploads/2020/11/Release-November-2020-Title.jpg200400Robert Lochnerhttps://data1.io/wp-content/uploads/2021/06/data1.io_Logo_Black-Orange-184-x-300-300x184.pngRobert Lochner2020-11-27 08:00:582020-11-29 08:53:23Release November 2020
We use cookies on our website to give you the most relevant experience by remembering your preferences and repeat visits. By clicking “Accept”, you consent to the use of all necessary and explicitly activated cookies.
This website uses cookies to improve your experience while you navigate through the website. Out of these cookies, the cookies that are categorized as necessary are stored on your browser as they are essential for the working of basic functionalities of the website. We also use third-party cookies that help us analyze and understand how you use this website. These cookies will be stored in your browser only with your consent. You also have the option to opt-out of these cookies. But opting out of some of these cookies may have an effect on your browsing experience.
Necessary cookies are absolutely essential for the website to function properly. This category only includes cookies that ensures basic functionalities and security features of the website. These cookies do not store any personal information.
Any cookies that may not be particularly necessary for the website to function and is used specifically to collect user personal data via analytics, ads, other embedded contents are termed as non-necessary cookies. It is mandatory to procure user consent prior to running these cookies on your website.
Analytical cookies are used to understand how visitors interact with the website. These cookies help provide information on metrics the number of visitors, bounce rate, traffic source, etc.